COVID-19: The Sefton neighbourhoods where infections rose fastest as UK records highest daily rate

and live on Freeview channel 276
The UK has recorded the highest number of new coronavirus infections since the beginning of the pandemic, the latest daily figures show.
Figures released on Friday, 24 December, revealed the nation had 122,186 new cases of COVID-19 and a further 137 deaths.
Advertisement
Hide AdAdvertisement
Hide AdThe previous day, there were 119,789 cases and 147 fatalities within 28 days of a positive test recorded.
In Sefton, director of public health Margaret Jones has urged people to get vaccinated to protect themselves and the NHS.
She said: “As we move towards 2022, we are facing a new variant of COVID-19 – the Omicron strain. The impacts of this variant are still far from fully understood, however we do know that we are seeing record numbers of national infections.
“I encourage everyone to get vaccinated, whichever dose is offered to you.”
COVID-19 infection rates
Advertisement
Hide AdAdvertisement
Hide AdAcross the UK, there were 521,602 positive test results in the week to December 16, up 51% from the week before.
Lambeth recorded the UK’s highest case rate, with 2477.2 cases per 100,000 people, while Scarborough recorded the lowest case rate, with 258.4 cases per 100,000 people recorded.
At a regional level, London has the highest infection rates in the UK, with 1455.8 cases per 100,000 people, followed by the East of England, with 893.5 cases per 100,000.
The North East has the lowest rate, with 435.3 cases per 100,000.
Advertisement
Hide AdAdvertisement
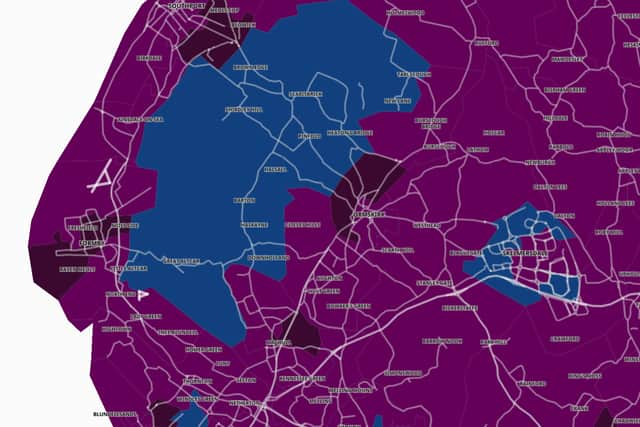
Hide AdAt neighbourhood level, COVID-19 case rates have been published for the week to December 16.
Here are the five neighbourhoods in Sefton with the biggest rise in case rates according to data for the past week.

1. Formby Central & Freshfield South
Formby Central & Freshfield South had 609.7 COVID-19 cases per 100,000 people in the latest weekly figures, a rise of 164.3% from the week before.
2. Formby South West
Formby South West had 725.4 COVID-19 cases per 100,000 people in the latest weekly figures, a rise of 122.2% from the week before.
3. Hesketh Park
Advertisement
Hide AdAdvertisement
Hide AdHesketh Park had 529.5 cases per 100,000 people in the latest weekly figures, a rise of 110.5% from the week before.
4. Formby South East & Ince Blundell
Formby South East & Ince Blundell had 499.6 cases per 100,000 people in the latest weekly figures, a rise of 86.7% from the week before.
5. Waterloo
Waterloo had 746.4 COVID-19 cases per 100,000 people in the latest weekly figures, a rise of 78.1% from the week before.