
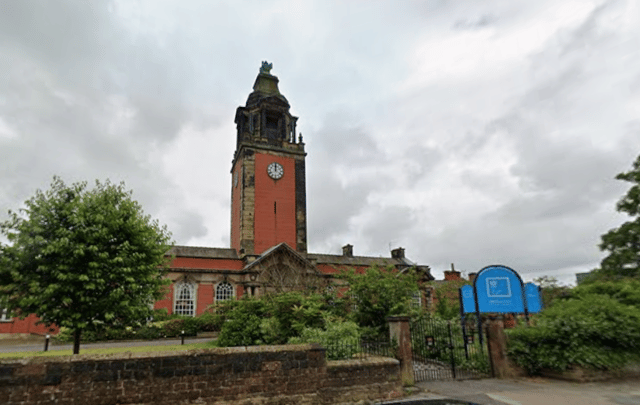


Progress 8 scores remains the main performance benchmark on which secondary schools are judged, however, the Department for Education (DFE) also publishes the raw percentage performance for English and maths - which are also given a double weighting when calculating each school’s Progress 8 score.
The main percentage on which schools are ranked is determined by the proportion of pupils achieving a grade 5 (strong pass) in maths and English, similar to a grade C.
Referring to Department for Education data for GCSE exams sat in the summer of 2024, the grade system runs from 9, which is the highest grade and loosely equivalent to an A*, to 1, which is the lowest, equivalent to a G.
Check out how your son or daughter’s school performed. Special schools have not been included. Data for some schools was unavailable.
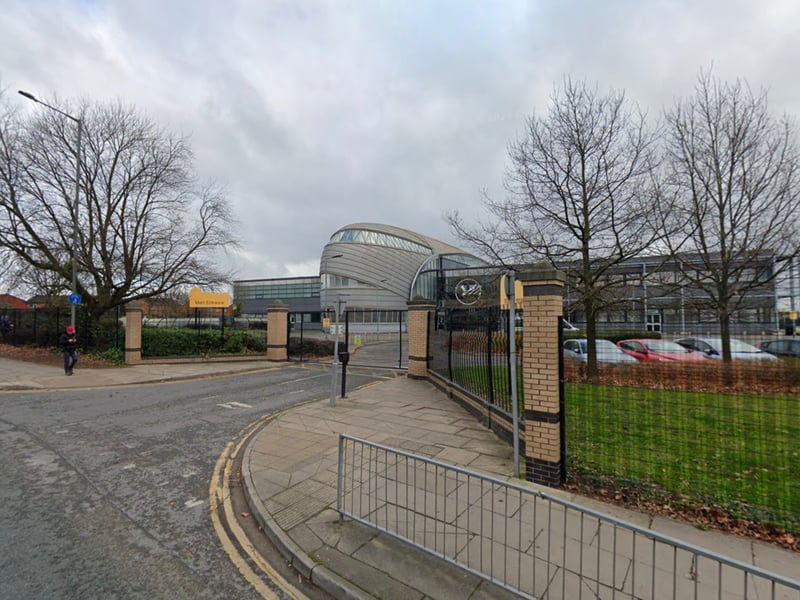
13. North Liverpool Academy, Liverpool
39% of pupils achieved Grade 5 or above in English & maths GCSEs. There were 218 pupils at end of Key Stage Four. | Google Street View
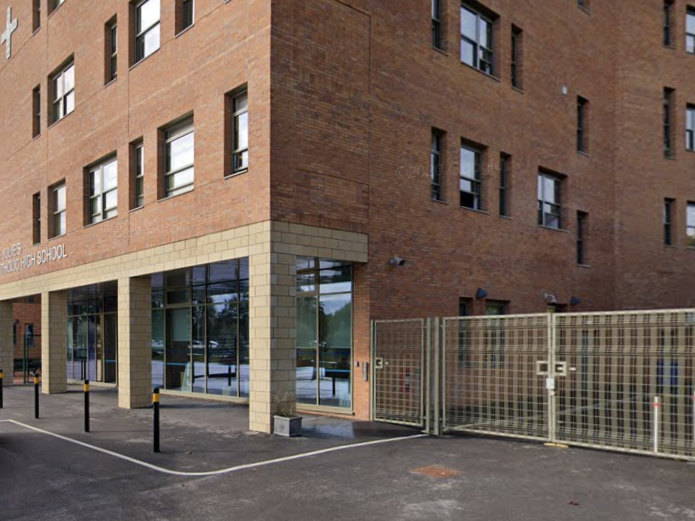
14. St Julie’s Catholic High School, Liverpool
37.7% of pupils achieved Grade 5 or above in English & maths GCSEs. There were 175 pupils at end of Key Stage Four. | google street view
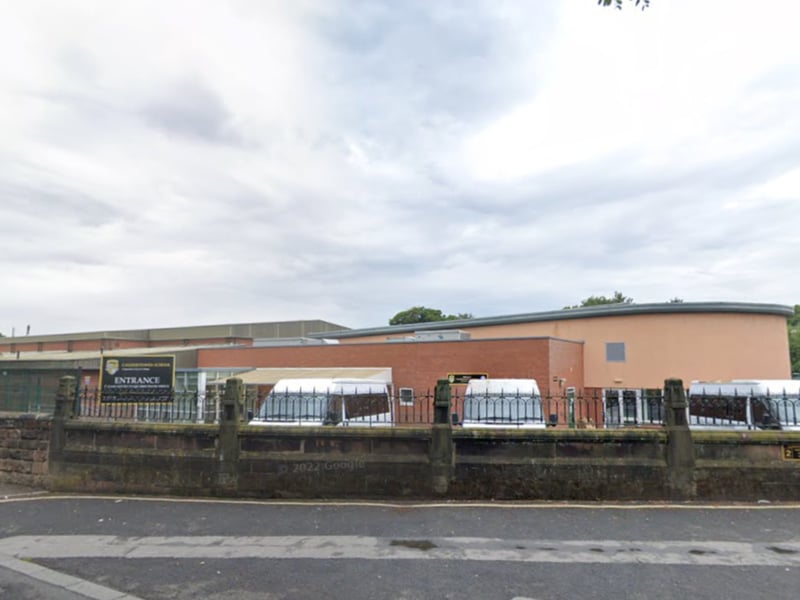
15. Calderstones School, Liverpool
35.8% of pupils achieved Grade 5 or above in English & maths GCSEs. There were 254 pupils at end of Key Stage Four. | Google
16. St Francis Xavier's College, Liverpool
35.6% of pupils achieved Grade 5 or above in English & maths GCSEs. There were 205 pupils at end of Key Stage Four. | Google