
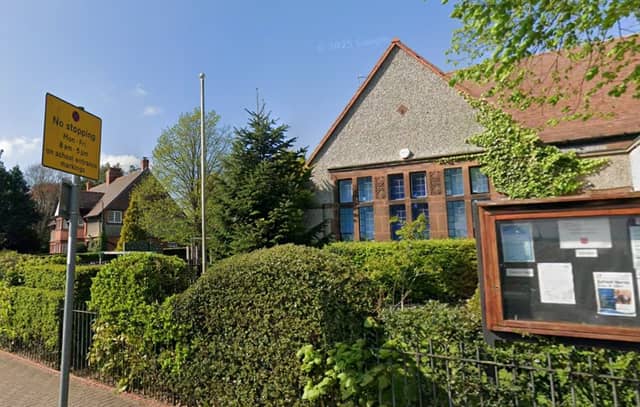


The latest Department for Education (DfE) primary school league table sees each school awarded a score out of 120 for SAT assessments in reading and maths. The average 'scaled’ scores' refer to Key Stage 2 assessments taken by pupils at the end of Year 6 in the summer of 2025.
We have ranked Wirral primary schools based on the proportion of students meeting the ‘expected standard’. According to the Department for Education, pupils are meeting the expected standard if they achieve a scaled score of 100 or more in their reading and maths tests, and their teacher assesses them as 'working at the expected standard' or better in writing.
Pupils are classed as achieving at a ‘higher standard’ if they achieve a scaled score of 110 or more in their reading and maths tests, and their teacher assesses them as ‘working at a greater depth within the expected standard’ in writing.
Take a look at the gallery below to see the 23 schools on the Wirral with the top performance.
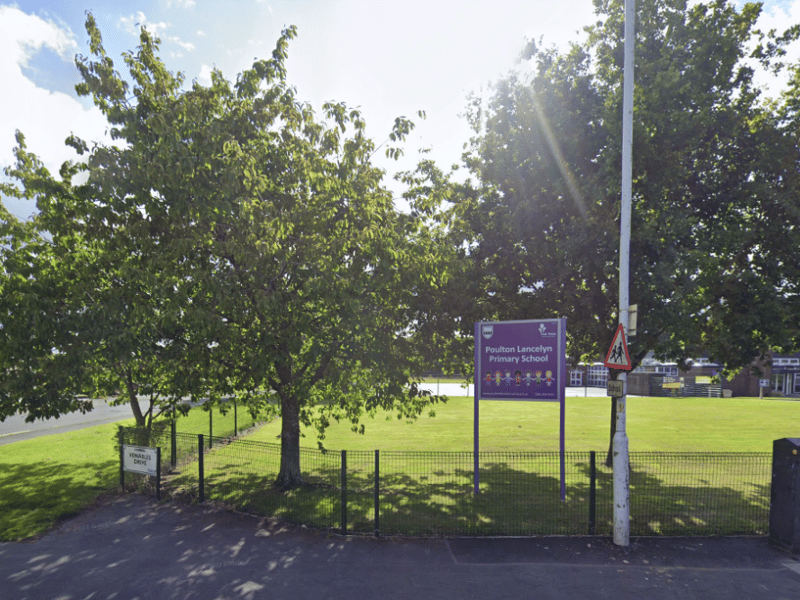
5. Poulton Lancelyn Primary School, Bebington
At Poulton Lancelyn, 83% of pupils met the expected standards in KS2 and 27% achieved a higher standard. Pupils achieved an average score of 110 in reading and 111 in maths. | Google Street View
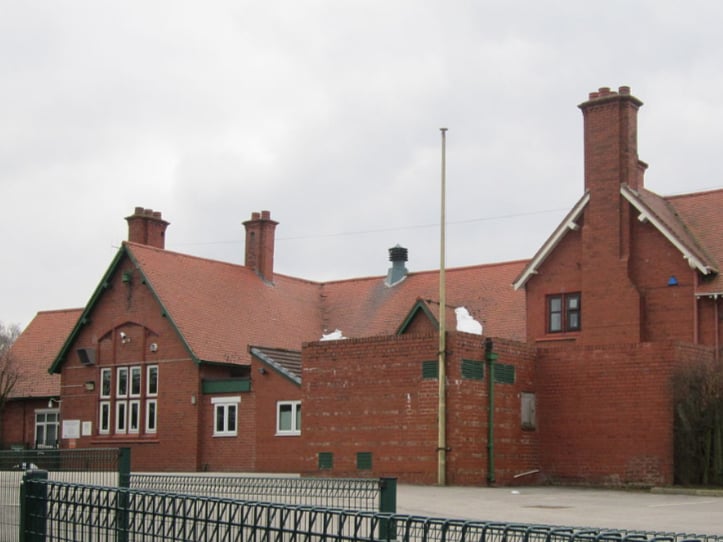
6. Thurstaston Dawpool CE Primary School, Thurstaston
At Dawpool CE Primary School, 83% of pupils met the expected standards in KS2 and 20% achieved a higher standard. Pupils achieved an average score of 112 in reading and 110 in maths. | Google
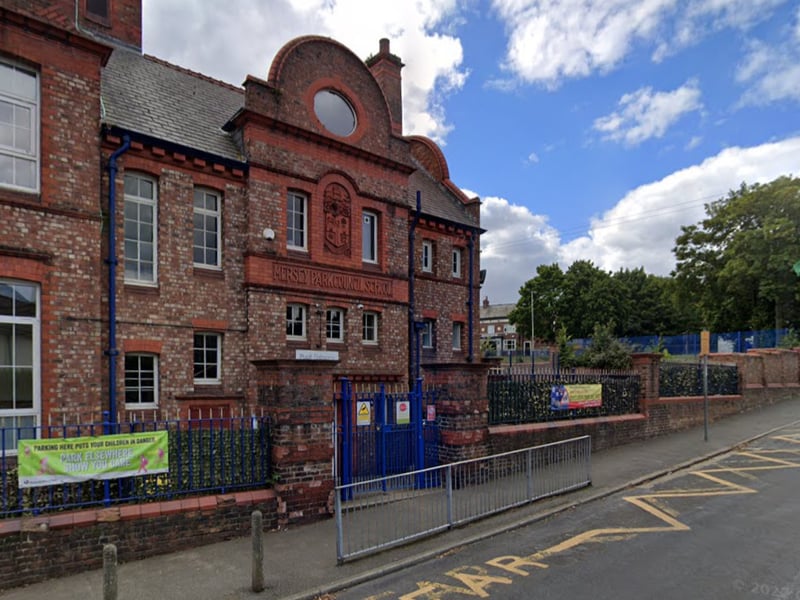
7. Mersey Park Primary School, Tranmere
At Mersey Park Primary School, 83% of pupils met the expected standards in KS2 and 8% achieved a higher standard. Pupils achieved an average score of 106 in reading and 107 in maths. | Google Street View
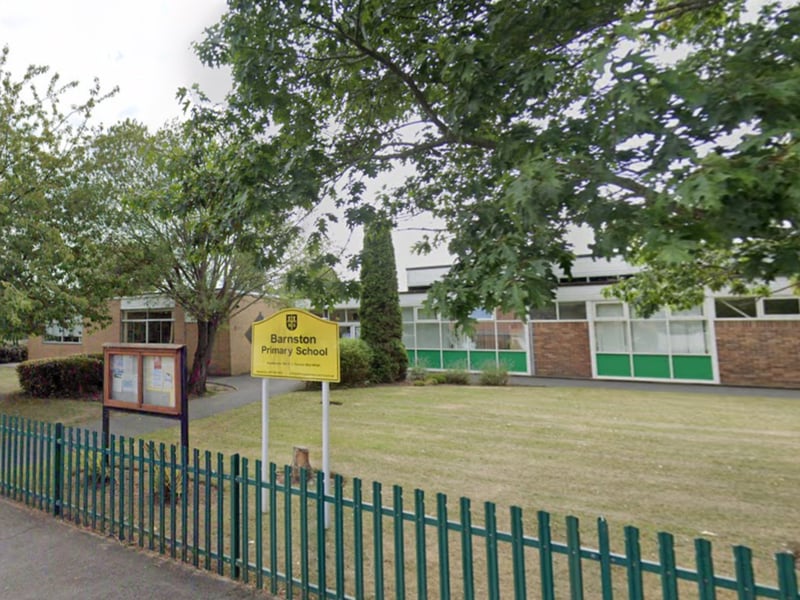
8. Barnston Primary School, Barnston
At Barnston Primary School, 82% of pupils met the expected standards in KS2 and 29% achieved a higher standard. Pupils achieved an average score of 109 in reading and 107 in maths. | Google Street View