

Patients across Merseyside have had their say on how their GP surgery is performing in the latest GP Patient Survey, produced by Ipsos on behalf of NHS England.
More than 700,000 patients in England completed the 2025 survey, which was carried out between January and March 2025, and gathered information on how patients feel their local surgery is performing.
Patients were asked a range of questions about their last appointment as part of the survey, including whether they felt their needs had been met. Across the country, the majority of patients said their needs had ‘definitely’ been met (57%) or had been met ‘to some extent’ (33%).
However, not every GP surgery meets the expectations of all its patients. Here we reveal the GP surgeries across Merseyside where the most patients felt their needs were not met. Surgeries are ranked by the proportion of patients who said their needs had ‘not at all’ been met during their last appointment.
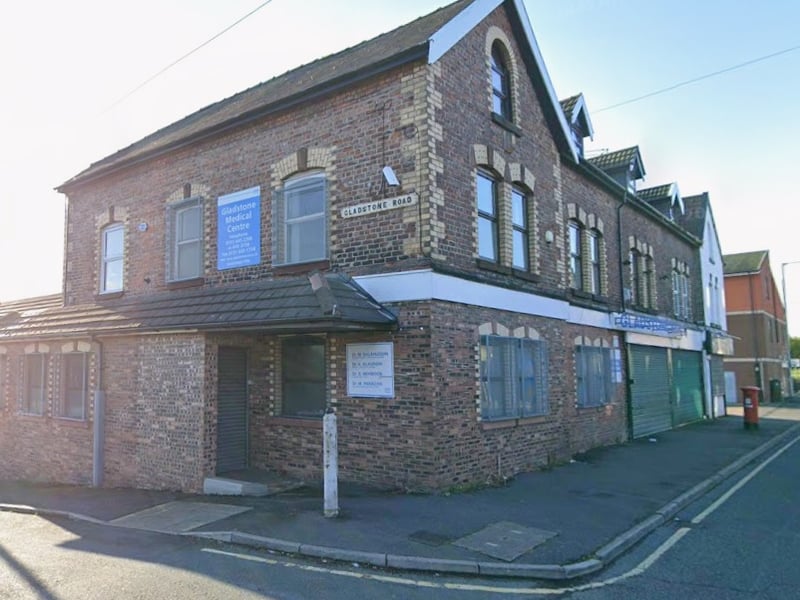
1. Gladstone Medical Centre - Birkenhead
There were 532 survey forms sent out to patients at Gladstone Medical Centre in Birkenhead, and the response rate was 17%. When asked if their needs were met during their last general practice appointment, 24% of patients said ‘no, not at all’. | Google Maps
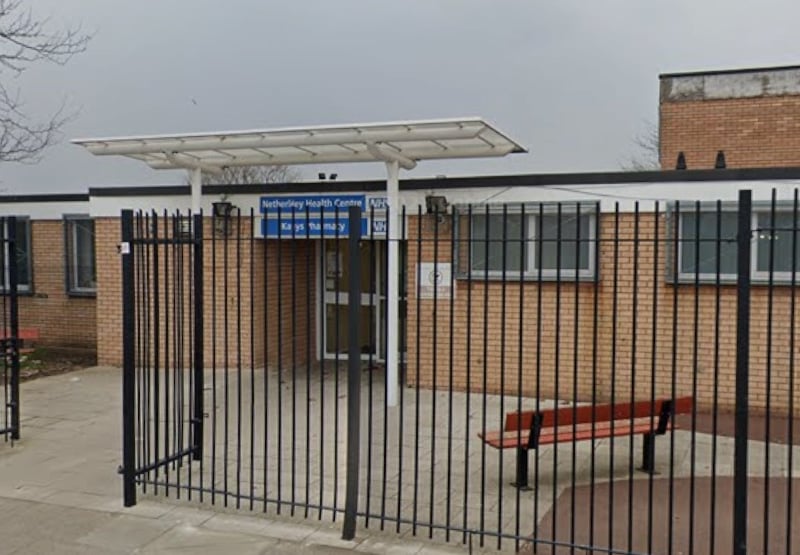
2. Netherley Health Centre - Netherley, Liverpool
There were 583 survey forms sent out to patients at Netherley Health Centre in Netherley, Liverpool, and the response rate was 19%. When asked if their needs were met during their last general practice appointment, 24% of patients said ‘no, not at all’. | Google Maps
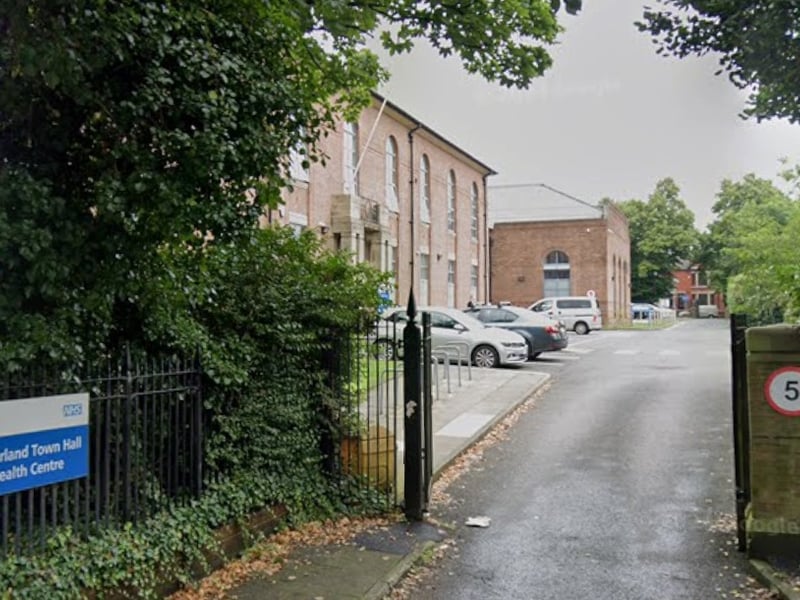
3. Litherland Practice - Litherland, Liverpool
There were 904 survey forms sent out to patients at Litherland Practice in Litherland, Liverpool, and the response rate was 22%. When asked if their needs were met during their last general practice appointment, 22% of patients said ‘no, not at all’. | Google Maps
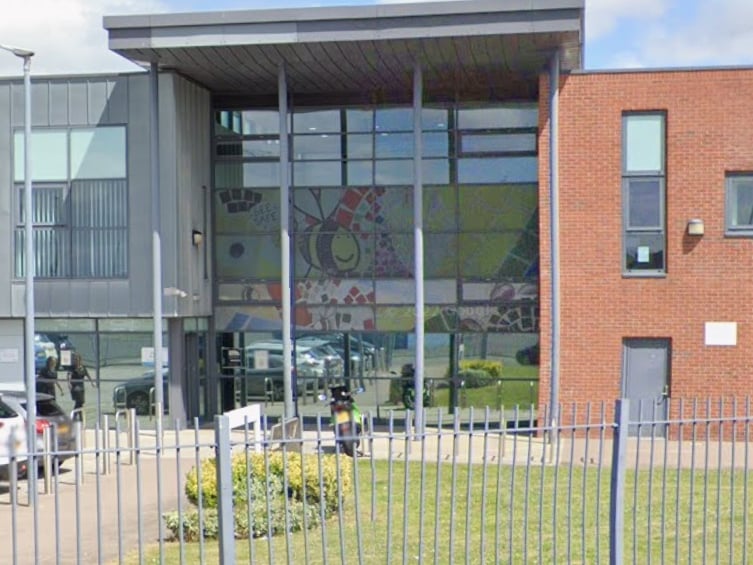
4. Cornerways Medical Centre - Huyton, Liverpool
There were 565 survey forms sent out to patients at Cornerways Medical Centre in Huyton, Liverpool, and the response rate was 17%. When asked if their needs were met during their last general practice appointment, 22% of patients said ‘no, not at all’. | Google Maps