


Some parts of Liverpool are seeing homes sell for huge amounts of money as house prices in the city bucked the national trend and continued to rise until the end of the year, when there was a slight drop.
According to the latest Land Registry figures, the average Liverpool house price in October 2023 was £173,230, while those looking to buy a detached property would have to spend around £349,216 on average.
Home sales company Property Solvers uses the Land Registry data to regularly track the average sold price for homes located across the country. Their figures, which were last updated in October 2023, includes streets across Liverpool and the city centre.
The statistics show that the cheapest street in the city had an average sold price of just £26,500, while the most expensive street was pushing £1 million. So, which streets in Liverpool are the most expensive?
Below are the most expensive streets, roads and avenues in each postcode in Liverpool and their average sale price, ranked in descending order.
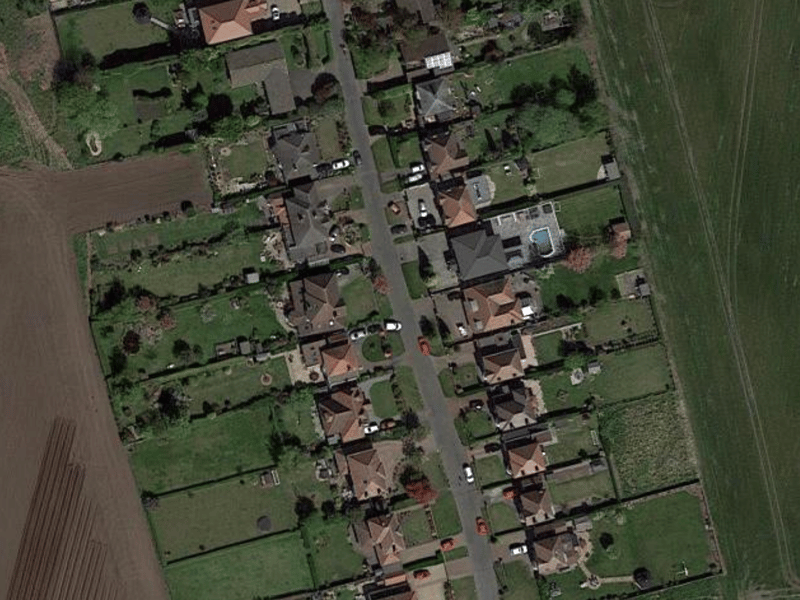
9. L24 - Church Road - £579,375
The average property price for Church Road (4BA) in Hale Village is £579,375 - based on four sales up to October 2023. | Google Maps
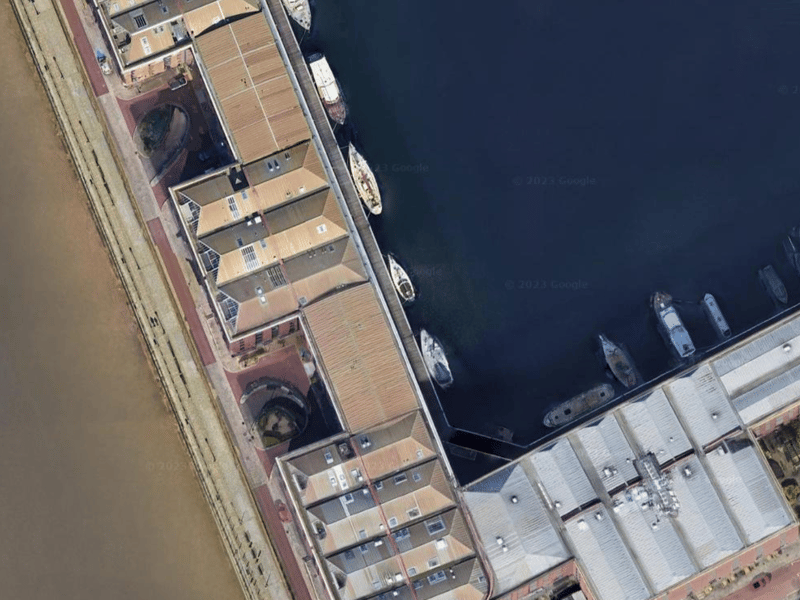
10. L3 - The Colonnades - £490,000
The average property price for The Colonnades (4AG) is £490,000 - based on five sales up to October 2023. | Google Maps
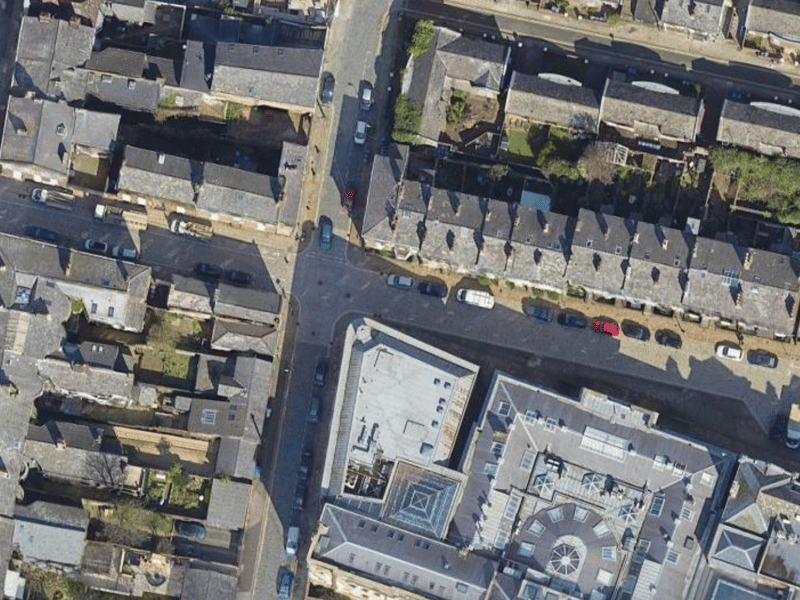
11. L1 - Mount Street - £480,500
The average property price for Mount Street is £480,500 - based on four sales up to October 2023. | Google Maps
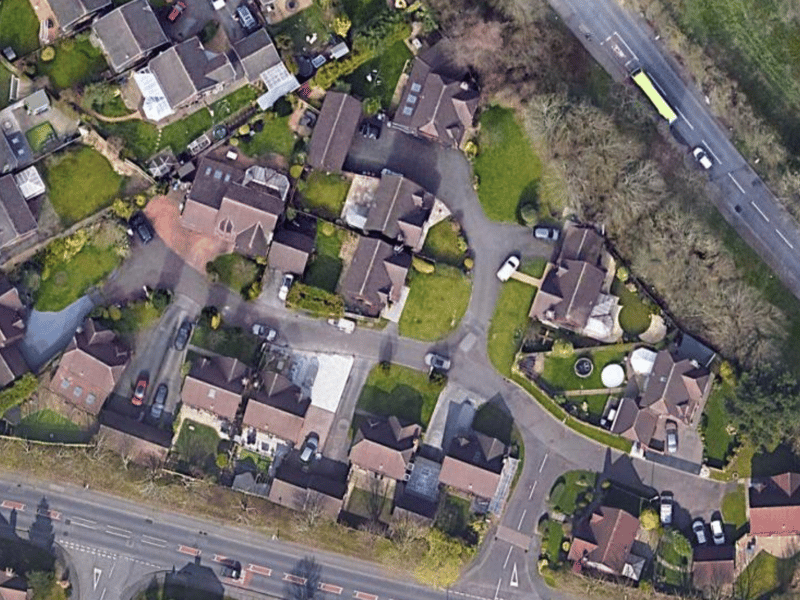
12. L26 - Redpoll Grove - £360,600
The average property price for Redpoll Grove in Halewood is £360,600 - based on five sales up to October 2023. | Google Maps