
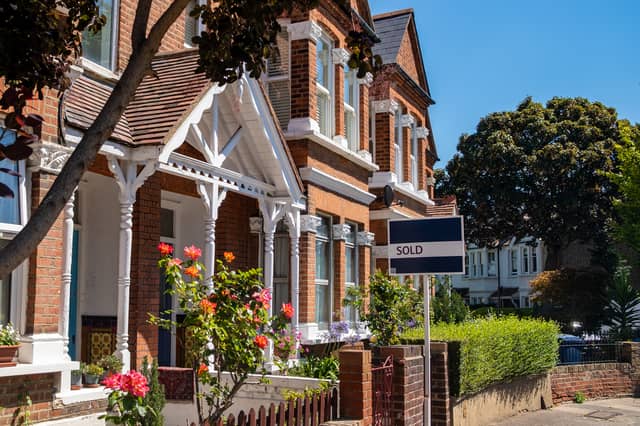


Residents living in Liverpool's wealthiest neighbourhood earn more than double than those living in the poorest area, according to the latest data from the Office for National Statistics (ONS).
The average households income figures, published by in October 2023 refer to the financial year ending in 2020 and reveal the shocking difference between Liverpool’s richest and poorest areas.
- Get the day’s biggest stories straight to your inbox with Liverpool World’s free newsletter emails
Before applying tax and housing costs, residents in the wealthiest part of the city saw a median average household income of 62,000, while the poorest area had an average household income of £28,000.
Here we reveal the 11 richest areas of Liverpool, based on the latest available ONS figures. Is your neighbourhood on the list?
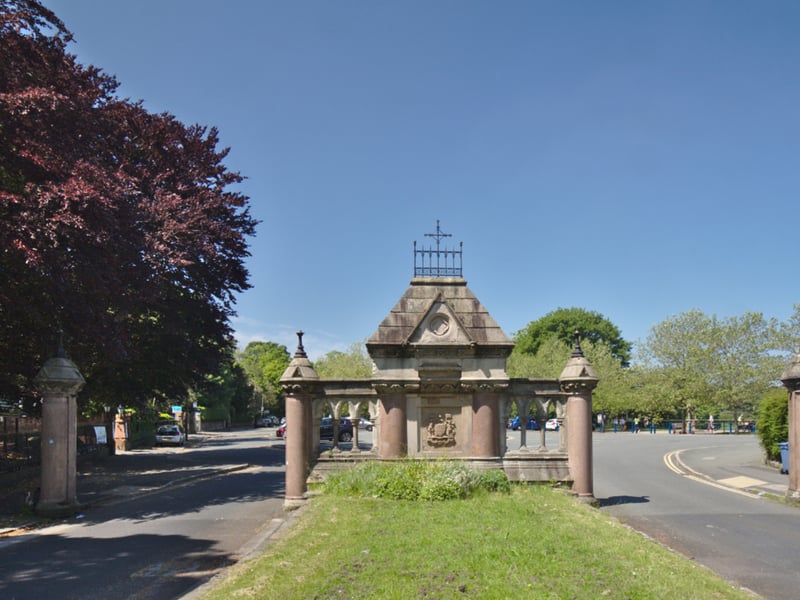
5. Aigburth & Grassendale
The average annual household income for Aigburth & Grassendale is £52,700 - according to the latest Office for National Statistics figures published in October 2023. | Phil Nash from Wikimedia Commons CC BY-SA 4.0 & GFDL Photo: Phil Nash from Wikimedia Commons CC BY-SA 4.0 & GFDL
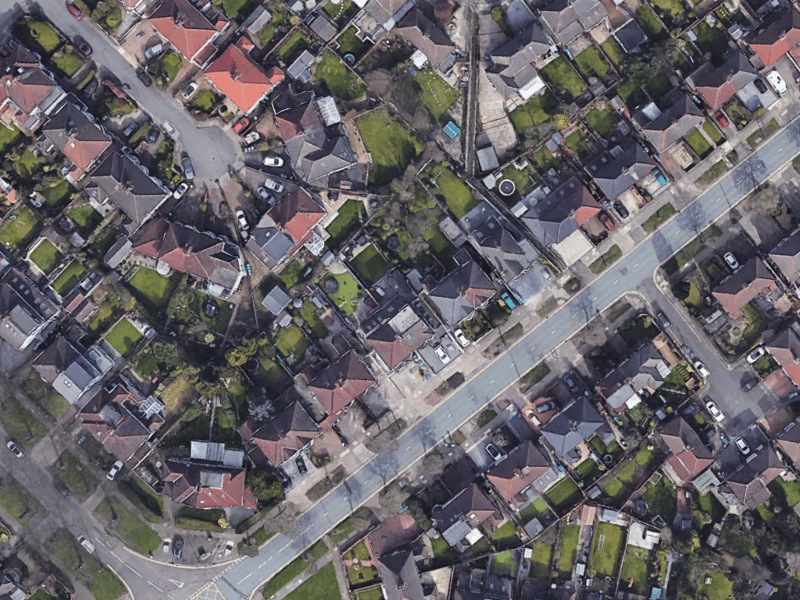
6. Childwall East - £49,700
The average annual household income for Childwall East is £49,700 - according to the latest Office for National Statistics figures published in October 2023. | Google Earth Photo: Google Earth
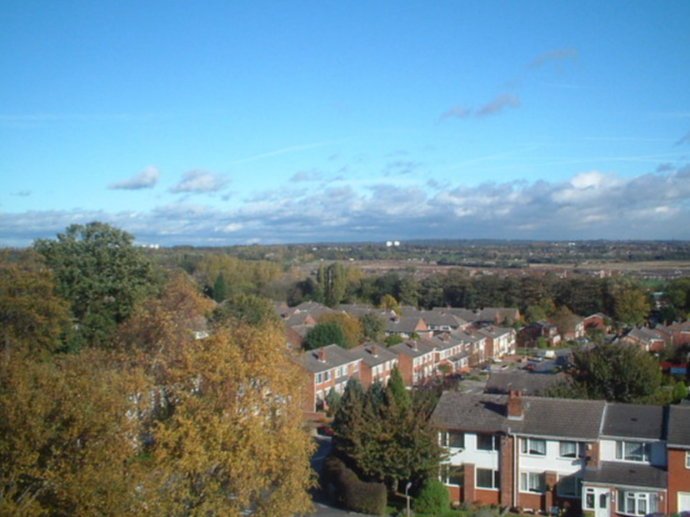
7. Gateacre - £48,800
The average annual household income for Gateacre is £48,800 - according to the latest Office for National Statistics figures published in October 2023. | Colin Pyle/Wikimedia Photo: Colin Pyle/Wikimedia
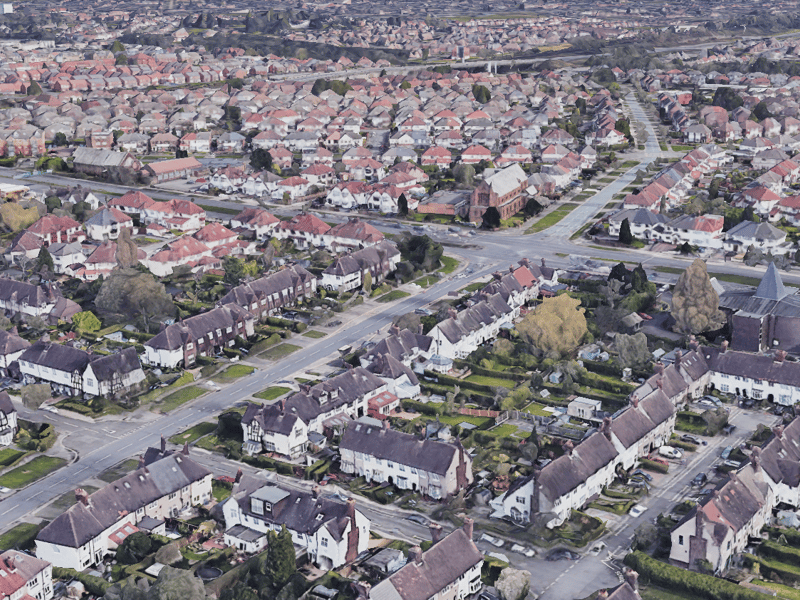
8. Broadgreen -
The average annual household income for Broadgreen is £47,600 - according to the latest Office for National Statistics figures published in October 2023. | Google Earth Photo: Google Earth