COVID-19: The Liverpool areas where infections rose fastest as UK records highest daily rate

and live on Freeview channel 276
The UK has recorded the highest number of new coronavirus infections since the beginning of the pandemic, the latest daily figures show.
Figures released on Friday, 24 December, said the nation had 122,186 new cases of COVID-19 and a further 137 deaths.
Advertisement
Hide AdAdvertisement
Hide AdThe previous day, there were 119,789 cases and 147 fatalities within 28 days of a positive test recorded.
In Liverpool, Mayor Joanne Anderson and Director of Public Health Matt Ashton have urged people to get vaccinated to protect themselves and the NHS.
While the Liverpool Health Protection Board (LHPB), which oversees the city’s response to the pandemic, says Omicron is now “a very serious threat” to the region and the health service.
The LHPB said: “The Omicron variant rate is doubling in less than two days in the North West, and almost a third of COVID cases are now Omicron variant. The reality is therefore that we are highly likely to be facing a record peak of cases in a few weeks.”
COVID-19 infection rates
Advertisement
Hide AdAdvertisement
Hide AdAcross the UK, there were 521,602 positive test results in the week to December 16, up 51% from the week before.
Lambeth recorded the UK’s highest case rate, with 2477.2 cases per 100,000 people, while Scarborough recorded the lowest case rate, with 258.4 cases per 100,000 people recorded.
At a regional level, London has the highest infection rates in the UK, with 1455.8 cases per 100,000 people, followed by the East of England, with 893.5 cases per 100,000.
The North East has the lowest rate, with 435.3 cases per 100,000.
Advertisement
Hide AdAdvertisement
Hide AdAt neighbourhood level, COVID-19 case rates have been published for the week to December 16.
Here are the five neighbourhoods in Liverpool with the biggest rise in case rates according to data for the past week.
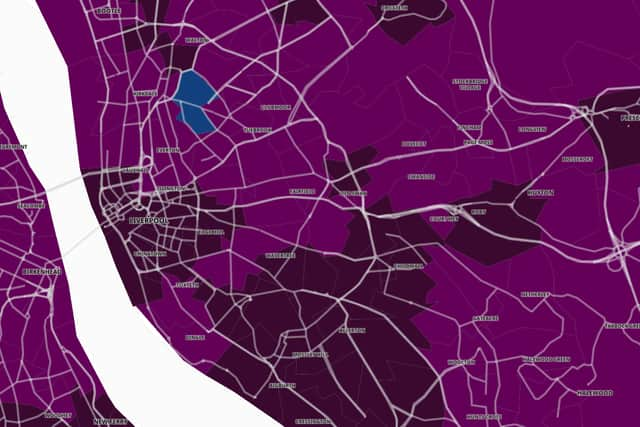

1. Albert Dock & Queen’s Dock
Albert Dock & Queen’s Dock had 815.6 COVID-19 cases per 100,000 people in the latest weekly figures, a rise of 213.1% from the week before.
2. Central & Islington
Central & Islington had 690.4 COVID-19 cases per 100,000 people in the latest weekly figures, a rise of 191.3% from the week before.
3. Edge Hill
Advertisement
Hide AdAdvertisement
Hide AdEdge Hill had 549.2 cases per 100,000 people in the latest weekly figures, a rise of 184.4% from the week before.
4. Wavertree South
Wavertree South had 642.5 cases per 100,000 people in the latest weekly figures, a rise of 136.6% from the week before.
5. Princes Park
Princes Park had 834.5 COVID-19 cases per 100,000 people in the latest weekly figures, a rise of 126.9% from the week before.
Comment Guidelines
National World encourages reader discussion on our stories. User feedback, insights and back-and-forth exchanges add a rich layer of context to reporting. Please review our Community Guidelines before commenting.