COVID: Liverpool areas where coronavirus infections rose the fastest in the past week

and live on Freeview channel 276
Coronavirus infections are on the rise across the UK following the easing of restrictions by the Government.
Liverpool has not escaped the upturn in figures with some areas of the city seeing more than a 250% rise in cases.
Advertisement
Hide AdAdvertisement
Hide AdHealth secretary Sajid Javid said the increase was to be “expected” but that country remains in a “very good position” generally speaking.
He said about 99.9% of infections in the UK were of the milder Omicron variant, although a new Deltacron variant - containing Delta and Omicron - has been indentified.
“We keep the situation very carefully under review. There’s no other variant of concern out there that is an issue at this point in time,” Javid told Sky News.
The latest data from the Office for National Statistics show there were 410,173 positive cases in the UK in the week ending 10 March, a 56% rise from the week before.
Advertisement
Hide AdAdvertisement
Hide AdAt a regional level, Scotland has the highest infection rate in the UK, recording 1,447.6 cases per 100,000 residents – nearly three times greater than in England, which recorded a rate of 542.1 during the same period.
Loading....
The figures include both positive PCR and lateral flow tests. They also include people infected with COVID-19 for the first time as well as reinfections.
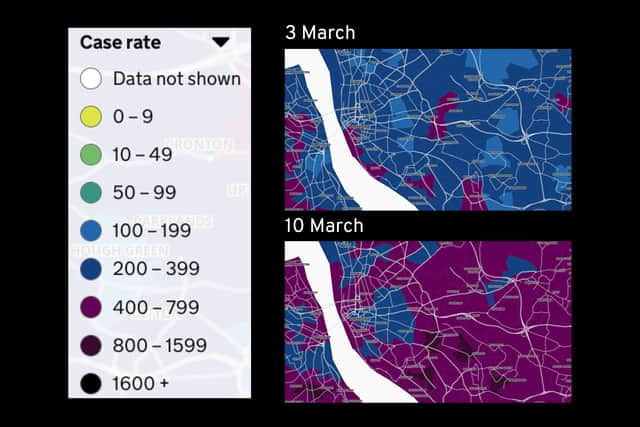
At neighbourhood level, COVID-19 case rates have been published for the week to 10 March.
Here are the neighbourhoods in Liverpool with the biggest rise in case rates in the past week.

1. Netherley
Advertisement
Hide AdAdvertisement
Hide AdNetherley had 644.5 COVID-19 cases per 100,000 people in the latest weekly figures, a rise of 270% from the week before.
2. Walton East
Walton East had 583.5 COVID-19 cases per 100,000 people in the latest weekly figures, a rise of 266.8% from the week before.
3. Croxteth Park
Croxteth Park had 795.6 COVID-19 cases per 100,000 people in the latest weekly figures, a rise of 223% from the week before.
4. Childwall West & Wavertree Green
Childwall West & Wavertree Green had 868.8 COVID-19 cases per 100,000 people in the latest weekly figures, a rise of 219.1% from the week before.
5. Walton North
Advertisement
Hide AdAdvertisement
Hide AdWalton North had 691.2 COVID-19 cases per 100,000 people in the latest weekly figures a rise of 200% from the week before.
6. Norris Green West
Norris Green West had 652 COVID-19 cases per 100,000 people in the latest weekly figures, a rise of 187.5% from the week before.
7. Wavertree East
Wavertree East had 767.1 COVID-19 cases per 100,000 people in the latest weekly figures, a rise of 152.2% from the week before.
8. Gateacre
Gateacre had 895.6 COVID-19 cases per 100,000 people in the latest weekly figures, a rise of 150% from the week before.
9. St Michael’s & Otterspool
Advertisement
Hide AdAdvertisement
Hide AdSt Michael’s & Otterspool had 660.6 COVID-19 cases per 100,000 people in the latest weekly figures, a rise of 131.8% from the week before.
10. Anfield East
Anfield East had 479.7 COVID-19 cases per 100,000 people in the latest weekly figures, a rise of 130% from the week before.
Comment Guidelines
National World encourages reader discussion on our stories. User feedback, insights and back-and-forth exchanges add a rich layer of context to reporting. Please review our Community Guidelines before commenting.