COVID still on the rise in 14 Liverpool neighbourhoods - is yours one of them?

and live on Freeview channel 276
Coronavirus case numbers remain stable but high across the UK, official figures show.
There were 693,096 cases in the week ending January 27, a 0.8% fall on the number seen the week before.
Advertisement
Hide AdAdvertisement
Hide AdIt is double the number of cases the UK saw in the last week of November, before the Omicron wave.
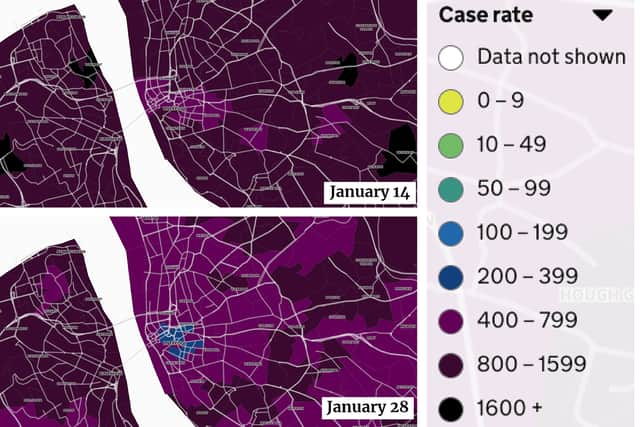
In Liverpool, cases dropped by 13.1% according to the latest weekly data, with a rate of 723.3 infections per 100,000 people.
At neighbourhood level, COVID-19 case rates have been published for the week to January 27.
Here are the neighbourhoods in Liverpool where coronavirus infections rose in the past week.

1. Princes Park
Advertisement
Hide AdAdvertisement
Hide AdPrinces Park had 1117.4 COVID-19 cases per 100,000 people in the latest week, a rise of 75.6% from the week before.
2. Wavertree South
Wavertree South had 687.8 COVID-19 cases per 100,000 people in the latest week, a rise of 40.7% from the week before.
3. Norris Green East
Norris Green East had 1198.3 COVID-19 cases per 100,000 people in the latest week, a rise of 34.2% from the week before.
4. Mossley Hill West & Sefton Park
Mossley Hill West & Sefton Park had 1036.7 COVID-19 cases per 100,000 people in the latest week, a rise of 30.6% from the week before.
5. Wavertree East
Advertisement
Hide AdAdvertisement
Hide AdWavertree East had 939.0 COVID-19 cases per 100,000 people in the latest week, a rise of 26.8% from the week before.
6. West Allerton
West Allerton had 766.3 COVID-19 cases per 100,000 people in the latest week, a rise of 25.6% from the week before.
7. Kensington
Kensington had 762.9 COVID-19 cases per 100,000 people in the latest week, a rise of 21.7% from the week before.
8. Sandfield Park & Holly Lodge
Sandfield Park & Holly Lodge had 771.4 COVID-19 cases per 100,000 people in the latest week, a rise of 15.9% from the week before.
9. Childwall East
Advertisement
Hide AdAdvertisement
Hide AdChildwall East had 886.0 COVID-19 cases per 100,000 people in the latest week, a rise of 13.5% from the week before.
10. Speke East
Speke East had 868.2 COVID-19 cases per 100,000 people in the latest week, a rise of 10.2% from the week before.
11. Stoneycroft
Stoneycroft had 720.2 COVID-19 cases per 100,000 people in the latest week, a rise of 9.1% from the week before.
12. Norris Green West
Norris Green West had 1034.7 COVID-19 cases per 100,000 people in the latest week, a rise of 7.3% from the week before.
13. Allerton
Advertisement
Hide AdAdvertisement
Hide AdAllerton had 941.8 COVID-19 cases per 100,000 people in the latest week, a rise of 3.3% from the week before.
14. Knotty Ash
Knotty Ash had 1064.1 COVID-19 cases per 100,000 people in the latest week, a rise of 2.7% from the week before.
Comment Guidelines
National World encourages reader discussion on our stories. User feedback, insights and back-and-forth exchanges add a rich layer of context to reporting. Please review our Community Guidelines before commenting.