
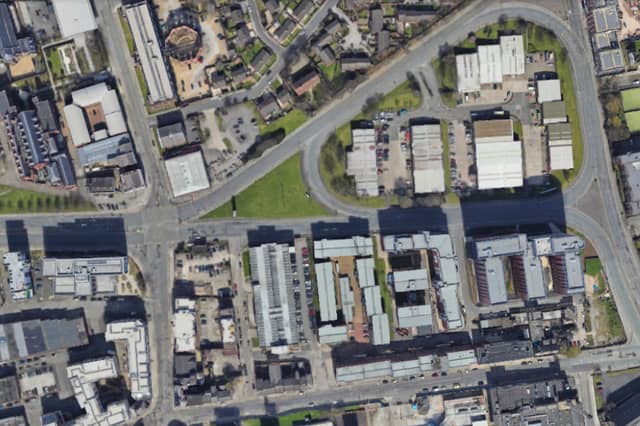


The data is provided by Local Insights using Merseyside Police’s crime numbers, which break down criminal offences reported in the city into specific neighbourhoods.
The latest data is for the period from September 2024 to August 2025, with the rankings based on the number of break-ins per 1,000 households in each neighbourhood.
The city of Liverpool is divided into 60 Middle Layer Super Output Areas (MSOAs) - or neighbourhoods - and the figures refer to where the burglaries occurred, not where they were reported from.
We have listed the neighbourhoods in the city with the largest number of reported burglaries in the gallery below. All photos are for illustrative purposes only and figures do not refer to any individual buildings or streets.
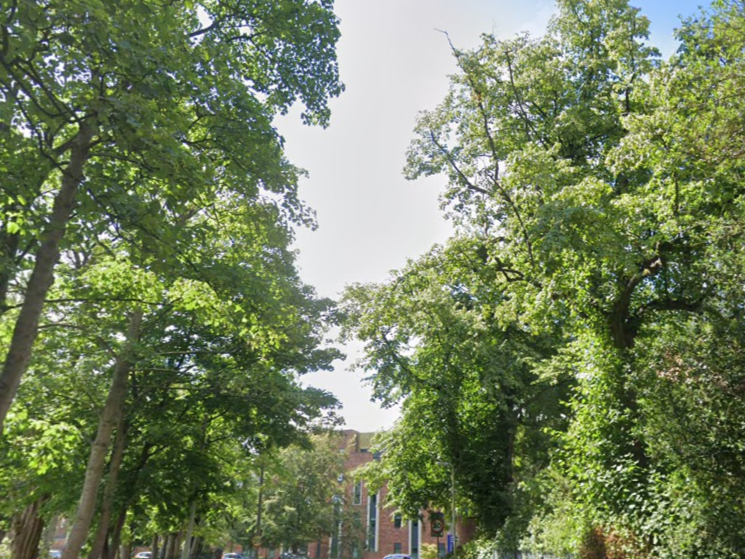
13. Wavertree Penny Lane
In the Wavertree Penny Lane area, there were 11.4 burglaries per 1,000 households. | Google