
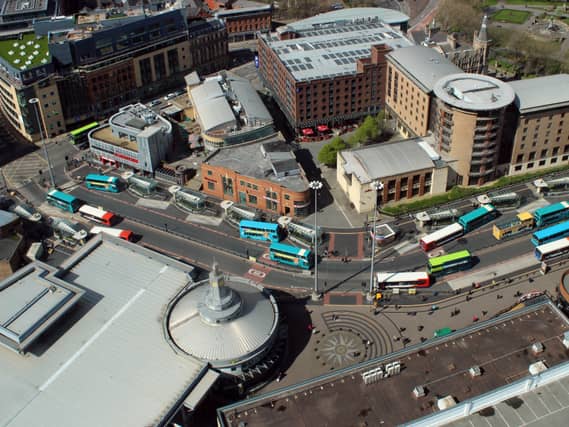


We have used figures from Local Insight based on Merseyside Police’s crime numbers, which breakdown total crime offences in the city into specific neighbourhoods.
The data is for the period from September 2023 to August 2024 - which is the most recent time period for which the figures are available - with the rankings based on the total neighbourhood-level incidents of criminal offences, and as a rate per 1,000 residents.
- These were the 20 worst areas in Liverpool for burglaries | Go beyond just reading the story - sign up for the LiverpoolWorld newsletter
The city of Liverpool is divided into 60 Middle Layer Super Output Areas (MSOAs) - or neighbourhoods - and the figures refer to where the crimes occurred, not where they were reported from.
We have listed the 17 neighbourhoods in the city with the largest number of reported crimes in the gallery below. All photos are for illustrative purposes only and figures do not refer to any individual buildings or streets.
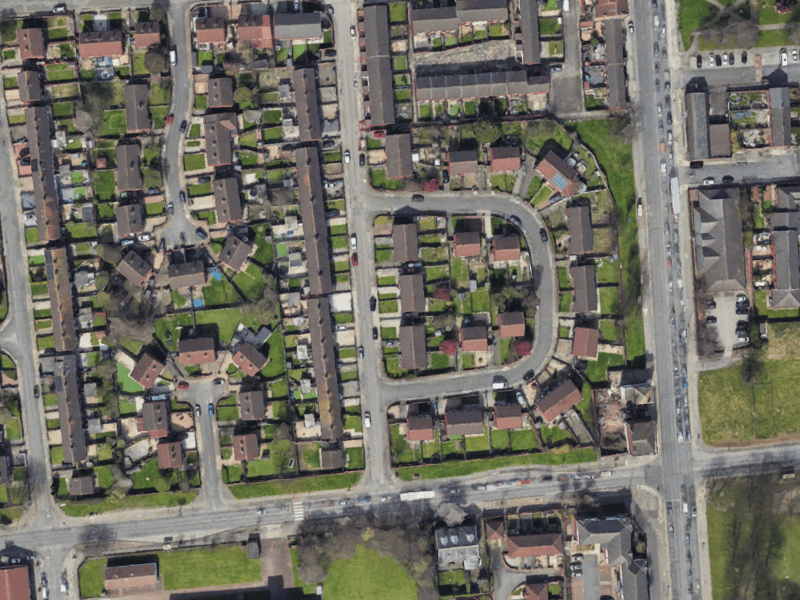
9. Everton West
In Everton West, there were 200.1 crime offences per 1,000 households. | Google Earth
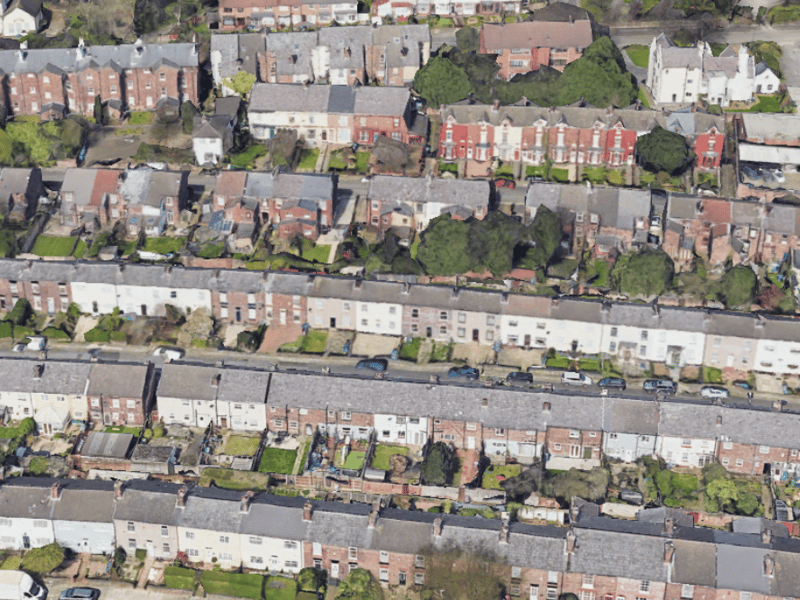
10. Fairfield East
In Fairfield East, there were 185.7 crime offences per 1,000 households. | Google Earth
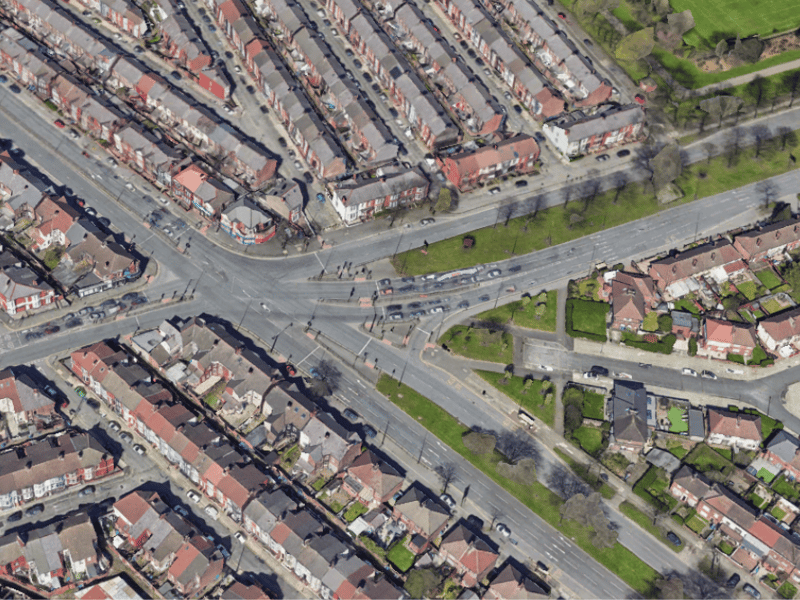
11. Walton Hall
In Walton Hall, there were 179.1 crime offences per 1,000 households. | Google Earth
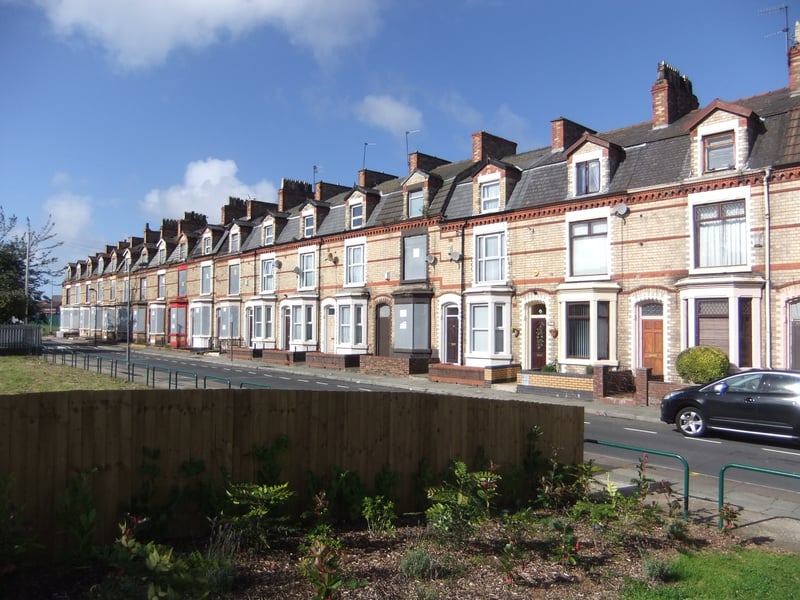
12. Anfield West
In Anfield West, there were 176 crime offences per 1,000 households. | Rept0n1x, CC BY-SA 3.0