Liverpool’s main COVID hotspots as case rates plummet across the city

and live on Freeview channel 276
Coronavirus cases are now falling in every local area of the UK as the Omicron wave subsides.
In Liverpool, there has been a 54% drop in cases, according to the latest weekly data from the Government.
Advertisement
Hide AdAdvertisement
Hide AdEvery one of the 380 council areas across the UK saw fewer people testing positive last week, when compared with the week before.
The North East remains the worst affected part of the UK, with a rate of 1,586.4 cases per 100,000 residents in the week to January 13.
This is a 39% fall from the rate seen the week before.
Yorkshire and the Humber had the second worst rate, at 1,205.2 cases per 100,000, followed by Northern Ireland, with 1,194.2 cases per 100,000.
By comparison, Liverpool has an average rate of 1037.2 cases per 100,000 - just above the England average of 1032 cases per 100,000 people.
Advertisement
Hide AdAdvertisement
Hide AdEngland’s Plan B measures are to end next Thursday, Prime Minister Boris Johnson has announced.
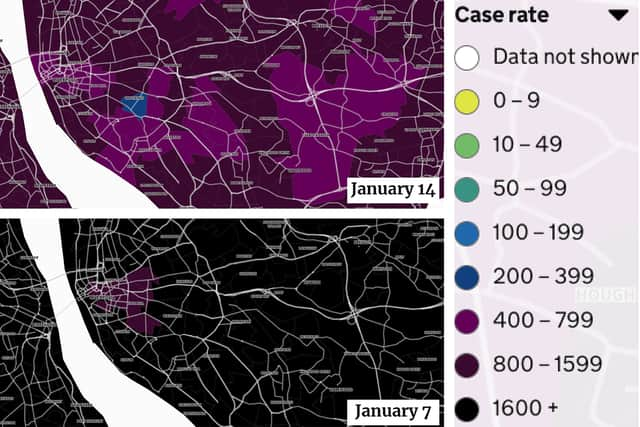
At neighbourhood level, COVID-19 case rates have been published for the week to January 13.
Here are the neighbourhoods in Liverpool with the highest case rates right now.

1. Netherley
Netherley had 1550.3 COVID-19 cases per 100,000 people in the latest week.
2. Knotty Ash
Advertisement
Hide AdAdvertisement
Hide AdKnotty Ash had 1470.2 COVID-19 cases per 100,000 people in the latest week.
3. Orrell Park
Orrell Park had 1446.7 COVID-19 cases per 100,000 people in the latest week.
4. Dingle
Dingle had 1368.8 COVID-19 cases per 100,000 people in the latest week.
5. Kirkdale North
Kirkdale North had 1364.6 COVID-19 cases per 100,000 people in the latest week.
6. Kirkdale South & Vauxhall
Advertisement
Hide AdAdvertisement
Hide AdKirkdale South & Vauxhall had 1352.9 COVID-19 cases per 100,000 people in the latest week.
7. Yewtree
Yewtree had 1320 COVID-19 cases per 100,000 people in the latest week.
8. Fazakerley South
Fazakerley South had 1318.5 COVID-19 cases per 100,000 people in the latest week.
Speke West & Airport had 1283.4 COVID-19 cases per 100,000 people in the latest week.
Croxteth West & Gillmoss had 1281.7 COVID-19 cases per 100,000 people in the latest week.
Comment Guidelines
National World encourages reader discussion on our stories. User feedback, insights and back-and-forth exchanges add a rich layer of context to reporting. Please review our Community Guidelines before commenting.