Revealed: Liverpool’s top 12 polluted primary schools - ‘threat cannot be overstated’

and live on Freeview channel 276
All of Liverpool’s primary schools are in areas exceeding the World Health Organisation’s safe guidelines for pollutants.
LiverpoolWorld analysed air quality data ranking areas on the three main pollutants - ultra fine particles (PM2.5), fine particles (PM10) and nitrogen dioxide (NO2).
Advertisement
Hide AdAdvertisement
Hide AdThe figures provided by air quality report website addressspollution.org revealed every primary school within Liverpool exceeded safe WHO limits for all three of these pollutants, raising concerns for the health of local children.
Last year, the World Health Organisation halved its guideline for a safe amount of ultra fine particles. Legally, however, the levels can be much higher.
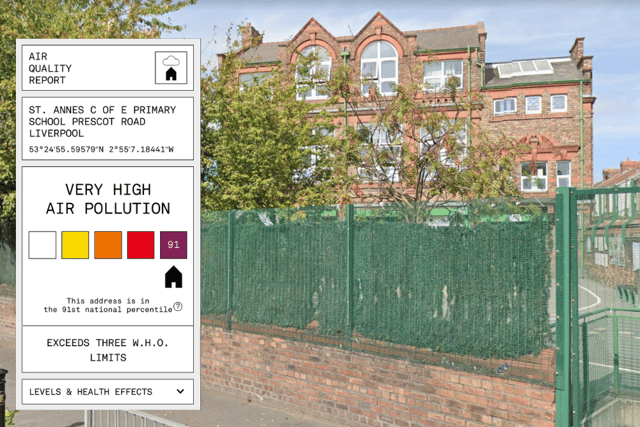

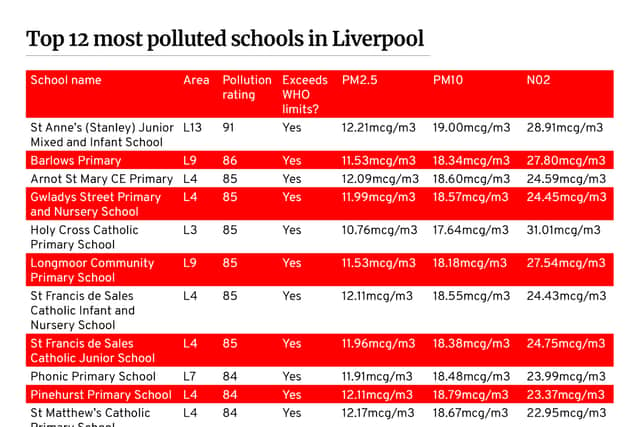
In ranking combining levels of all three key pollutants, St Anne’s Church of England Primary School, Prescot Road, came out worst in Liverpool, with more polluted air than 91% of addresses across the UK.
The schools with the least air pollutants were St Ambrose Catholic Primary School, Speke, and Banks Road Primary, Garston. However, both of these schools had more polluted air than 50% of addresses across the UK, and exceeded WHO safe guidelines.
What’s been said
Advertisement
Hide AdAdvertisement
Hide AdHarriet Wilson-Edwards, Senior Policy and Project Manager at Asthma + Lung UK, told LiverpoolWorld: “It’s shocking that primary school children are being forced to learn, play and grow up in air so dirty it could set them up for a lifetime of poor lung health. This is no doubt a major issue in Liverpool, where both air pollution and lung disease rates are high. But sadly we also know that nearly a third of all schools and colleges in the whole of England are located in areas of high pollution.
“This Liverpool data is yet further evidence that the council needs to get an urgent handle on the city’s air pollution problem. The threat caused by toxic air cannot and should not be overstated – tiny and harmful particles, smaller than the width of a human hair, can cause a range of serious health conditions when breathed in, including lung cancer, and trigger symptoms in people living with existing lung conditions.
“Children are particularly at risk as their lungs are small, growing and fragile and because children breathe at a faster rate than adults do.
“Despite this growing body of evidence showing how dangerous air pollution can be, Liverpool has recently rolled back on its clean air proposals, which would have covered some of the most polluted schools in the area. Further delays could see a new generation of children condemned to breathing in dirty, dangerous air. We need to see bold action from Liverpool City Council, to introduce more ambitious and targeted interventions to clean up the air the city is breathing.”
Liverpool City Council have been contacted for a comment.
Top 12 polluted primary schools
Advertisement
Hide AdAdvertisement
Hide AdEach address in the UK has been ranked according to its air pollution levels, relative to other addresses in the country. For example, a ranking of 90 means the address is more polluted than 90% of other addresses.
Please note, the data from addresspollution.org was collected by Imperial College in April 2022.
What are the three main pollutants?
Particulate matter (PM) refers to everything in the air that is not a gas and may be toxic. Some of these toxins may enter the bloodstream and cause serious impacts to health, especially in vulnerable groups of people such as the young, elderly, and those with respiratory problems.
These fine particles are known to cause asthma, chronic obstructive pulmonary disease and lung cancer. They come mainly from traffic fumes, but also through industrial processes and wood and coal fires.
Advertisement
Hide AdAdvertisement
Hide AdParticulates are classified according to size, as this can affect how easily the enter the bloodstream. The UK is focused on PM where particles are less than 10 micrometres in diameter (PM10) and less than 2.5 micrometres in diameter (PM2.5). PM10 may be referred to as fine, and PM2.5 as ultra fine.
Nitrogen dioxide (NO2) is a gas that is mainly produced during the combustion of fossil fuels, including coal and oil, along with nitric oxide. According to the government, “short-term exposure to concentrations of NO2 can cause inflammation of the airways and increase susceptibility to respiratory infections and to allergens.”
WHO safe guidelines for pollutants
Last year, the World Health Organisation halved its guideline for a safe amount of PM2.5 from 10 to 5 micrograms per cubic metre, annually.
WHO’s safe limit for PM10 is an annual average of 15 micrograms per cubic metre.
Advertisement
Hide AdAdvertisement
Hide AdLegally, however, the levels can be much higher, according to The Air Quality Standards Regulations 2010:
- An annual average of 40 micrograms per cubic metre for PM10;
- A 24-hour average of micrograms per cubic metre more than 35 times in a single year for PM10;
- An annual average of 20 micograms per cubic metre for PM2.5.
Safe limits of nitrogen dioxide are an annual mean concentration of 10 micrograms per cubic metre, however, the legal limit is 40 micrograms per cubic metre.
According to WHO, the legal limit of NO2 is far too high, they state: “Exposure (for a year or more) to 30mcg leads to a 5.5% increased risk of disease related mortality.”