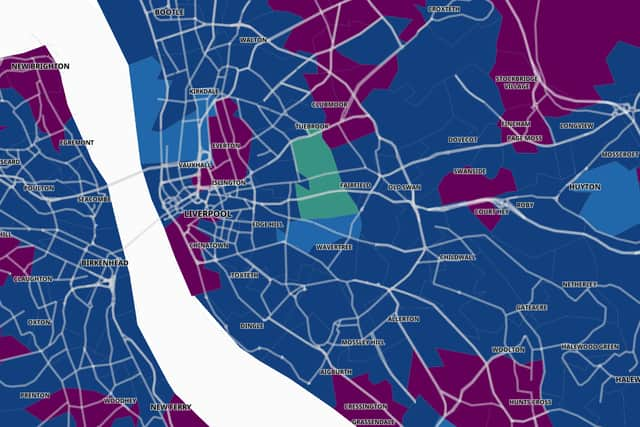
The Liverpool areas with highest COVID infections in the past week
and live on Freeview channel 276
Covid case numbers have now returned to the levels last seen before the emergence of the highly infectious Omicron variant.
Data shows that cases fell by almost a quarter last week from the week prior, decreasing to 320,341 cases throughout the country.
It is the lowest number since November 30 last year.
Advertisement
Hide AdAdvertisement
Hide AdAt a regional level, Northern Ireland had the highest case rate in the week to February 17, at 975.4 cases per 100,000 residents.
This was followed by Scotland, with 789 cases per 100,000 residents.
The lowest case rate was in Wales, with 241.5 cases per 100,000 residents.
The figures include both positive PCR and lateral flow tests.
Advertisement
Hide AdAdvertisement
Hide AdSo, which areas in Liverpool saw had the highest rates of Covid in the past week?

1. Orrell Park
Orrell park had 594.2 cases per 100,000 people in the latest week, falling by 34.3% from the week prior when the rate was 904.2 per 100,000.
2. Muirhead Avenue
Muirhead saw a rise in cases of 100%, and last week there were 562.6 cases per 100,000 people, double that of the 281.3 cases per 100,000 the week before.
3. Walton Vale
Walton Vale had 523.6 cases per 100,000 people in the past week, a rise of only 2.9% from the week prior.
4. Norris Green West
Advertisement
Hide AdAdvertisement
Hide AdNorris Green West had 510.3 cases per 100,000 people in the past week, falling by almost a hundred cases since the week prior, seeing a 16.3% decrease.
5. Fazakerley South
Fazakerley South experienced no change since the week prior, with both weeks registering 508.9 cases per 100,000 people.
6. Aigburth & Grassendale
Aigburth & Grassendale saw cases drop steeply (a decrease of 35.3%) to 477.8 from 738.5 cases per 100,000 people.
7. Albert Dock & Queen’s Dock
Albert Dock & Queen’s Dock had a small decrease in numbers, with 475.8 cases per 100,000 people last week, from 498.4 the week prior: a reduction of 4.5%.
8. Croxteth West & Gillmoss
Advertisement
Hide AdAdvertisement
Hide AdCroxteth West & Gillmoss had 464.9 cases per 100,000 people in the past week, falling by 11.9% from 527.8 the week prior.
9. Allerton
Allerton had 463.4 cases per 100,000 in the past week, up by 10.7% the week prior, when there were 418.6 cases per 100,000.
10. Mossley Hill East
Mossley Hill East saw numbers increasing slightly, by 7.7%, to 460.6 cases per 100,000 people from 427.7 the week prior.
Comment Guidelines
National World encourages reader discussion on our stories. User feedback, insights and back-and-forth exchanges add a rich layer of context to reporting. Please review our Community Guidelines before commenting.