
People wanting to buy a home in an up-and-coming part of Sefton can find out which areas to look at, thanks to new figures.
Some parts of England have seen house prices rocket by as much as 50% or more in just a year, analysis of official figures shows.
Almost three quarters of neighbourhoods in England saw an increase in property prices in the year to September 2022, but some have seen hundreds of thousands of pounds added onto the average sale price.
Property price data published in the UK House Price Index (HPI) shows the average price for a home in England was £312,513 in September 2022, a 9% increase on the previous year when the average property cost £286,832.
The Office for National Statistics publishes localised house price figures, based on the HPI, breaking England into 6,809 neighbourhoods known as middle-layer super output areas.
In total 71% of these neighbourhoods in England saw an increase in average house prices, with 12 recording at least a 50% rise, in the year to September 2022.
As the figures cover small areas, average house prices can fluctuate due to low sales numbers and can be heavily influenced by factors such as a new development in the area.
Here we reveal which neighbourhoods in Sefton have seen the greatest increase in property prices in the last year. Images are for illustrative purposes only.

1. Waterloo
Waterloo had the fastest rising house prices in Sefton - increasing by 27.9%, from an average of £180,000 in September 2021 to £230,250 in September 2022. A difference of £50,250 in sale price. Photo: Google Street View

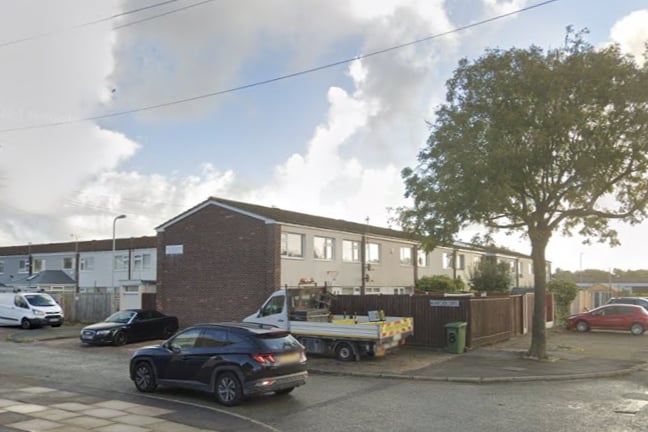
2. Bootle South
Bootle South had the second fastest rising house prices in Sefton - increasing by 24.9%, from an average of £80,000 in September 2021 to £99,950 in September 2022. A difference of £19,950 in sale price. Photo: User Rept0n1x via Wikimedia
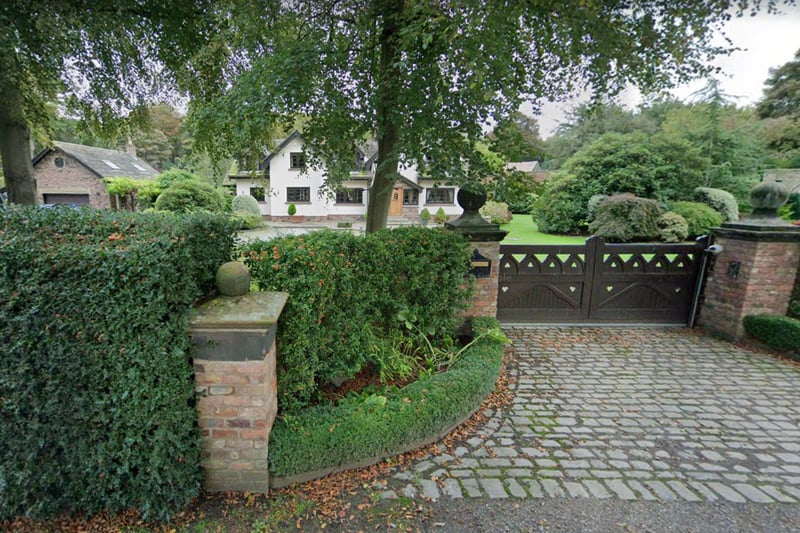
3. Formby South East & Ince Blundell
Formby South and Ince Blundell had the third fastest rising house prices in Sefton - increasing by 21.9%, from an average of £235,000 in September 2021 to £285,995 in September 2022. A difference of £50,995 in sale price. Photo: Google Street View
4. Netherton North
Netherton North had the fourth fastest rising house prices in Sefton - increasing by 18.8%, from an average of £100,000 in September 2021 to £118,750 in September 2022. A difference of £18,750 in sale price. Photo: Google