Coronavirus: 12 areas of Liverpool with fastest rising rates as city bosses issue COVID warning

and live on Freeview channel 276
The UK’s rocketing coronavirus rates are now beginning to slow, official figures show.
There were 605,313 cases in the week ending March 24, just 6% higher than the week before - an indication that the latest wave may soon peak.
Advertisement
Hide AdAdvertisement
Hide AdBut professor Matt Ashton, Liverpool director of public health, has warned that despite an end to coronavirus restrictions “the pandemic hasn’t finished yet” and infection rates across the city remained high.
Speaking during a meeting of the Liverpool Health and Wellbeing Board at Liverpool Town Hall professor Ashton also paid tribute to the effort of people across the city as Liverpool continues its fight against coronavirus.
He said: “On behalf of Cllr Frazer Lake (cabinet member for adults’ and children’s social care) and myself, a big thank you to everyone for their support for the city’s response to the COVID-19 pandemic.
“Obviously the pandemic hasn’t finished yet, in fact our rates in Liverpool are still quite high, over 720 per 100,000, but we are moving into that new phase of pandemic management so living with, hopefully safely and fairly with COVID.”
Advertisement
Hide AdAdvertisement
Hide AdA a regional level across the UK there are huge variations in COVID rates.
The North East of England has seen the highest weekly rise in case rates at 33%, with 775 cases per 100,000 residents.
Here in the North West, we saw a 15.8% increase with a rise to 767 cases per 100,000 residents.
The current BA.2 wave has seen case rates hit the second highest level in the pandemic so far, after the Omicron wave of the past winter.
Advertisement
Hide AdAdvertisement
Hide AdAcross the UK, hospitalisations are at about half the numbers seen at their peak, in January 2021, while the number of deaths is well below those seen before the vaccine rollout.
But high case rates, and the resulting absences, are still causing disruption in schools and hospitals.
The lifting of many restrictions, waning effectiveness of boosters and the spread of the highly contagious BA.2 ‘stealth Omicron’ variant have all been touted as potential reasons for the current wave.
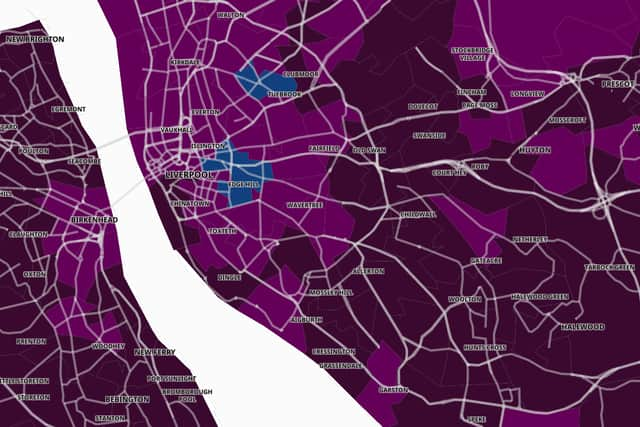
At neighbourhood level, COVID-19 case rates have been published for the week to March 24.
Advertisement
Hide AdAdvertisement
Hide AdThe figures include people infected with COVID-19 for the first time as well as reinfections.
Here are the neighbourhoods in Liverpool with the biggest rise in case rates in the past week.

1. Knotty Ash
Knotty Ash had 1022.1 COVID-19 cases per 100,000 people in the latest weekly figures, a rise of 87.2% from the week before.
2. Netherley
Netherley had 940.6 COVID-19 cases per 100,000 people in the latest weekly figures, a rise of 86.2% from the week before.
3. Walton North
Advertisement
Hide AdAdvertisement
Hide AdWalton North had 799.7 COVID-19 cases per 100,000 people in the latest weekly figures a rise of 84.4% from the week before.
4. Walton Hall
Walton Hall had 824.8 COVID-19 cases per 100,000 people in the latest weekly figures a rise of 77.4% from the week before.
5. Walton Vale
Walton Vale had 927.4 COVID-19 cases per 100,000 people in the latest weekly figures a rise of 67.6% from the week before.
5. Walton Vale
Walton Vale had 927.4 COVID-19 cases per 100,000 people in the latest weekly figures a rise of 67.6% from the week before.
6. Central & Islington
Advertisement
Hide AdAdvertisement
Hide AdCentral & Islington had 499.7 COVID-19 cases per 100,000 people in the latest weekly figures, a rise of 61.7% from the week before.
7. Woolton
Woolton had 998.9 COVID-19 cases per 100,000 people in the latest weekly figures, a rise of 53.2% from the week before.
8. Allerton
Allerton had 1091.3 COVID-19 cases per 100,000 people in the latest weekly figures, a rise of 49% from the week before.
9. Croxteth West & Gillmoss
Croxteth West & Gillmoss had 766.5 COVID-19 cases per 100,000 people in the latest weekly figures, a rise of 48.8% from the week before.
10. Tuebrook
Advertisement
Hide AdAdvertisement
Hide AdTuebrook had 729.8 COVID-19 cases per 100,000 people in the latest weekly figures, a rise of 47.7% from the week before.
11. Speke West & Airport
Speke West & Airport had 956 COVID-19 cases per 100,000 people in the latest weekly figures, a rise of 46% from the week before.
12. Wavertree West
Wavertree West had 728.5 COVID-19 cases per 100,000 people in the latest weekly figures, a rise of 43.2% from the week before.
Comment Guidelines
National World encourages reader discussion on our stories. User feedback, insights and back-and-forth exchanges add a rich layer of context to reporting. Please review our Community Guidelines before commenting.