
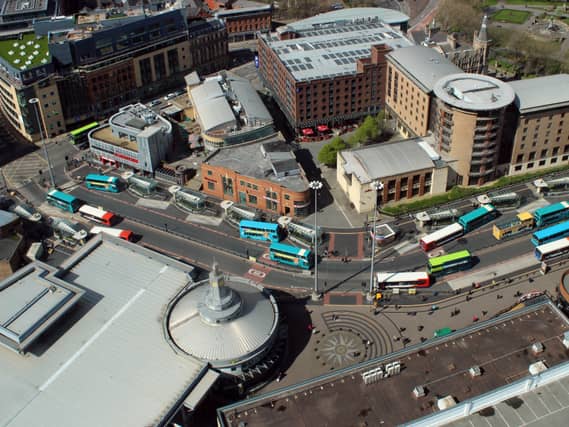


We have used data from Local Insight - based on Merseyside Police’s crime numbers - which breakdown the total incidents of anti-social behaviour (ASB) in the city into specific neighbourhoods.
The data is for the period from June 2024 to May 2025 - which is the most recent time period for which the figures are available - with the rankings based on the total neighbourhood-level incidents of ASB, and at a rate per 1,000 residents.
Anti-social behaviour can refer to a variety incidents, from abandoning vehicles and general nuisance behaviour to trespassing or the misuse of fireworks. The data referred to within this article refers to ASB incidents reported to the police.
The city of Liverpool is divided into 60 Middle Layer Super Output Areas (MSOAs) - or neighbourhoods - and the figures refer to where the incidents occurred, not where they were reported from.
We have listed the 16 neighbourhoods in the city with the largest number of reported incidents of anti-social behaviour in the gallery below. All photos are for illustrative purposes only and figures do not refer to any individual buildings or streets.
Merseyside Police this week announced that it has secured £2.39 million in funding from the Home Office to continue its hotspot policing initiative into 2025/26, reinforcing its commitment to tackling serious violence and antisocial behaviour (ASB) in the region’s most affected areas.
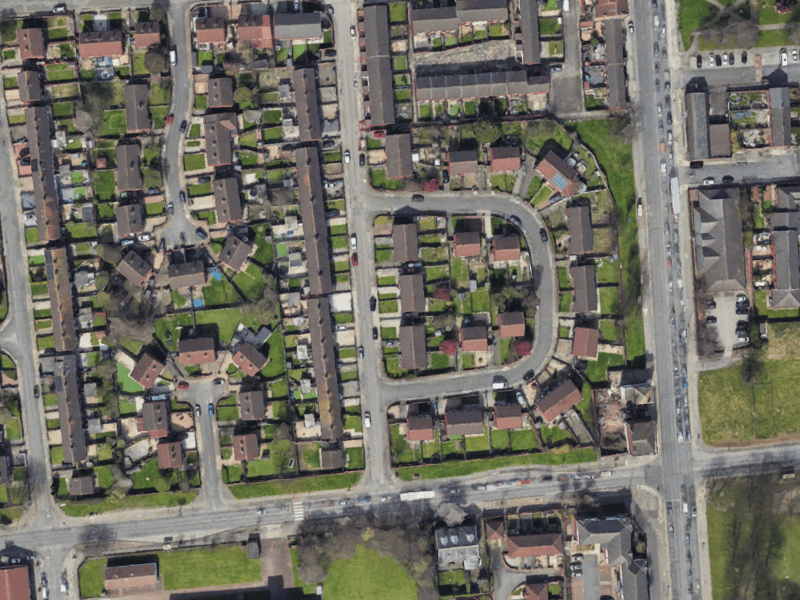
5. Everton West
24.6 incidents of ASB per 1,000 residents. | Google Earth
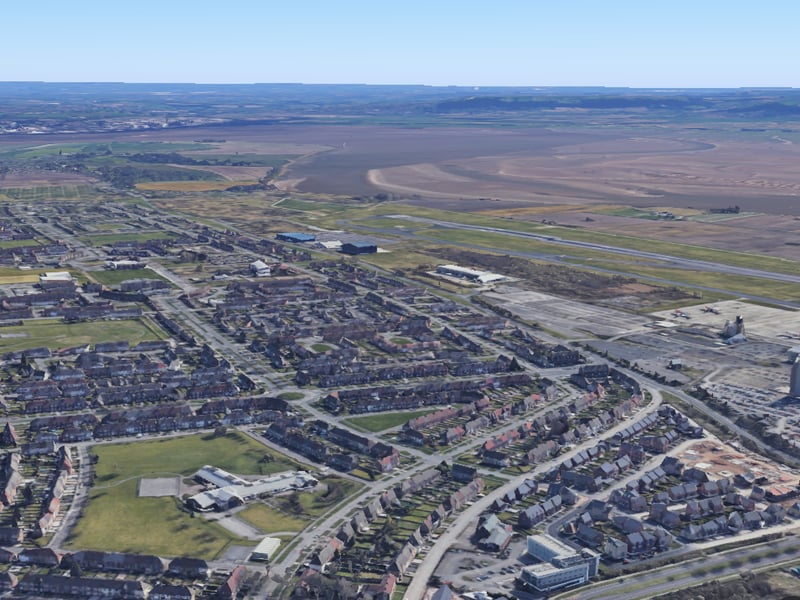
6. Speke West & Airport
21.3 incidents of ASB per 1,000 residents. | Google
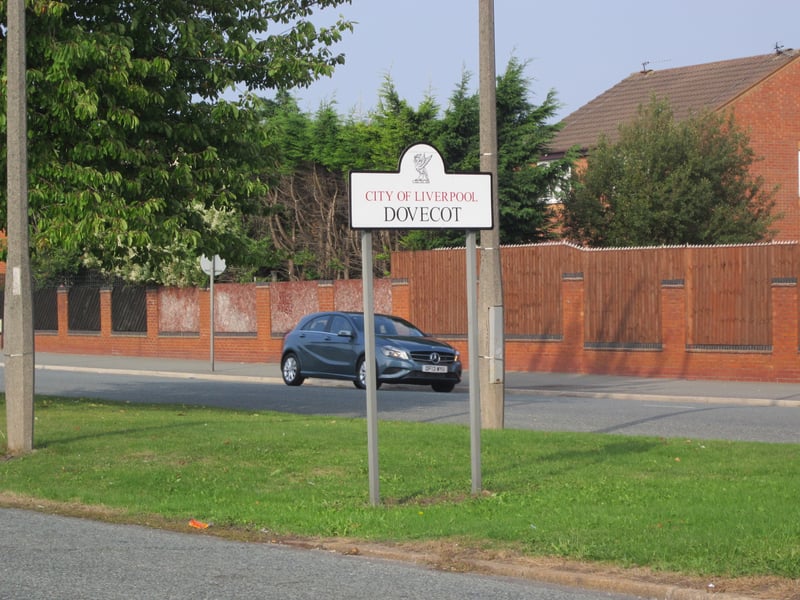
7. Dovecot
21.1 incidents of ASB per 1,000 residents. | Rept0n1x, CC BY-SA 3.0
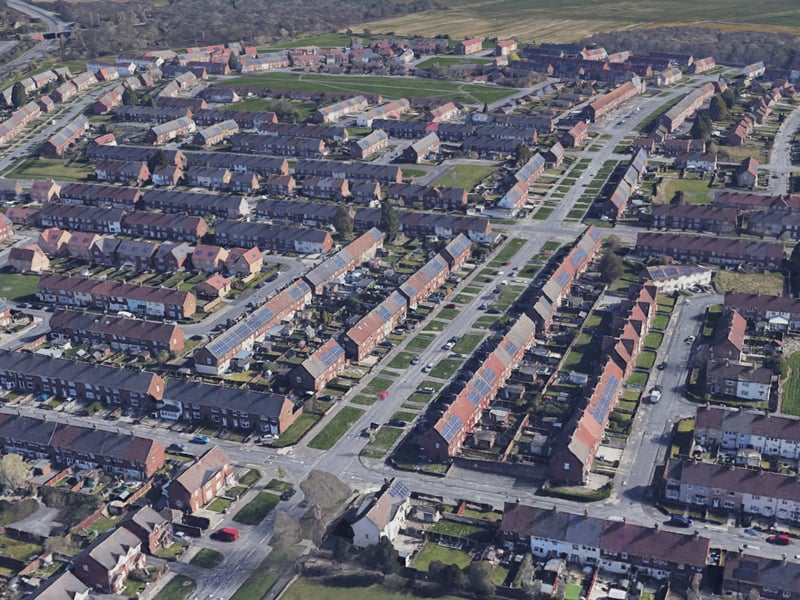
8. Speke East
18.7 incidents of ASB per 1,000 residents. | Google Earth