
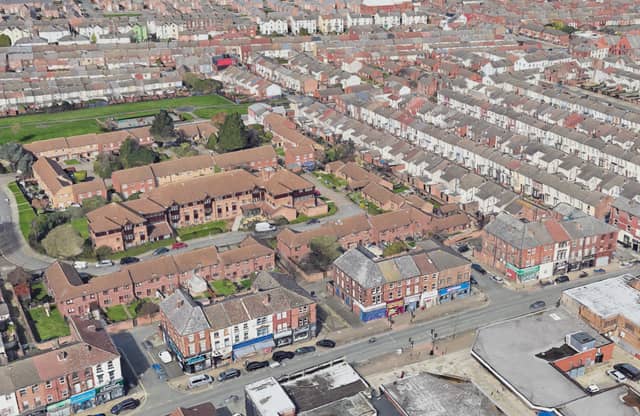


These are the 15 ‘most deprived’ parts of Liverpool, according to the latest official data released by the Ministry of Housing, Communities & Local Government (MHCLG)
The English Indices of Deprivation (IoD25) measure relative levels of deprivation in 33,755 small areas (LSOAs - Lower Layer Super Output area) across the country.
The IoD25 uses the LSOAs from the 2021 Census to measure deprivation at a small area level. Seven key categories of deprivation are analysed to create an overall Index of Multiple Deprivation (IMD).
The MHCLG clarifies that while this can be used to ‘identify the most deprived small areas’, they do not suggest that every one living in an area is struggling, or that those in less deprived areas are wealthy.
We have explored the new data via Local Insight and uncovered the 15 most deprived Liverpool neighbourhoods based on their IMD score. We have ranked the areas as MSOAs (Middle Layer Super Output areas) rather than LSOAs, as they are larger and easier for readers to recognise on a neighbourhood level.
Take a look at the gallery below to see the most deprived neighbourhoods, with higher IMD scores indicating higher levels of deprivation.
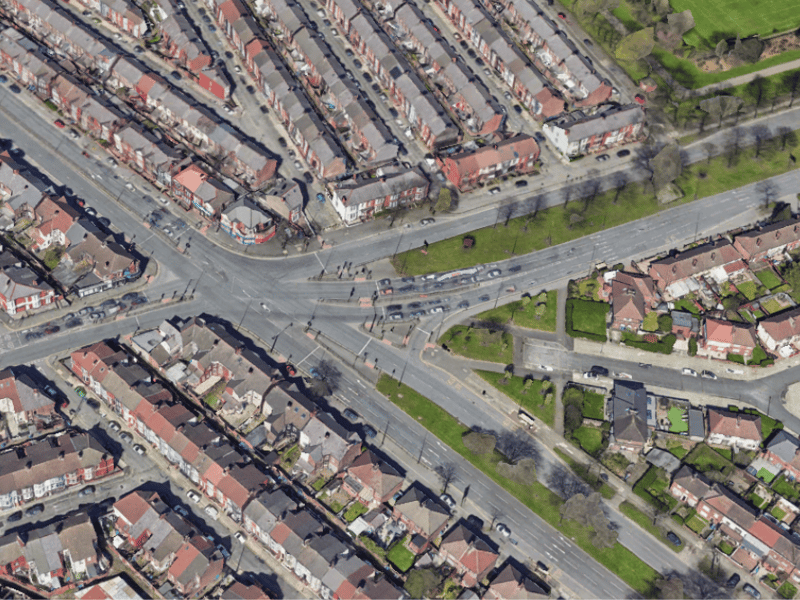
9. Walton Hall
IMD score of 56.35. | Google Earth
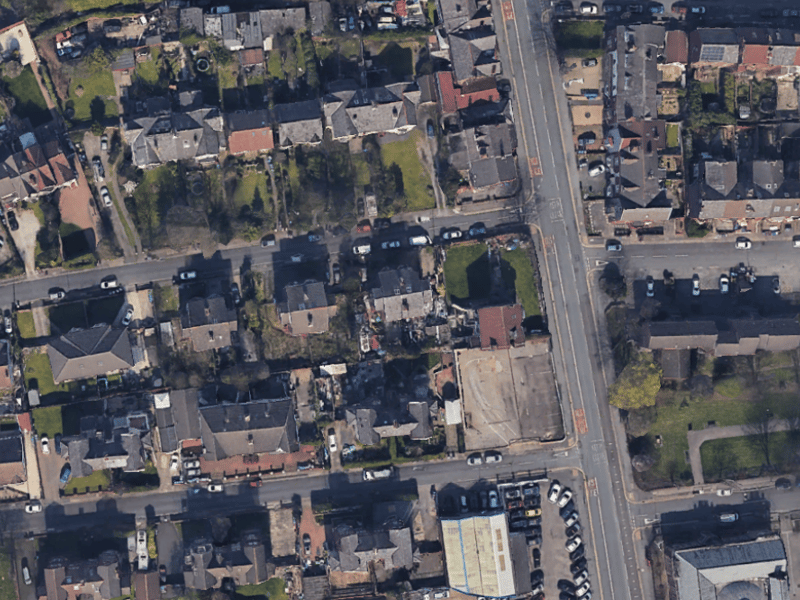
10. Walton North
IMD score of 55.83. | Google Earth
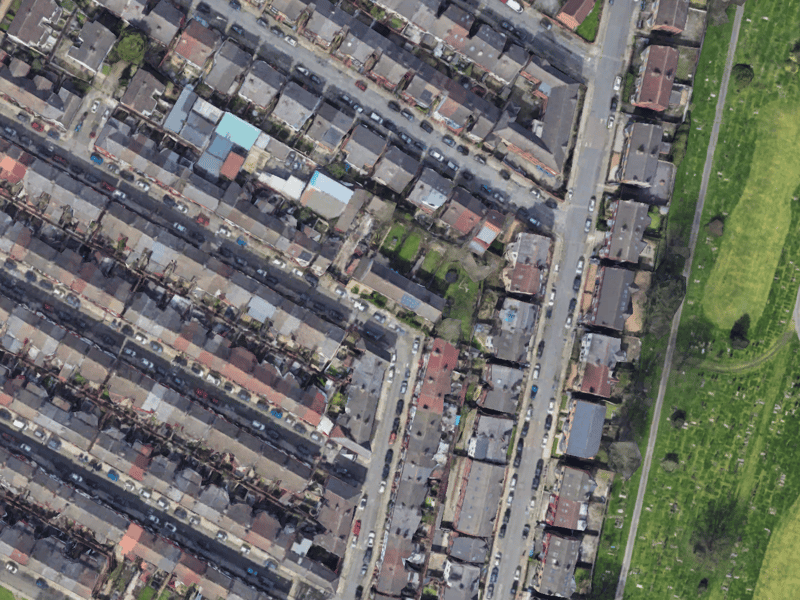
11. Toxteth
IMD score of 54.97. | Google Earth
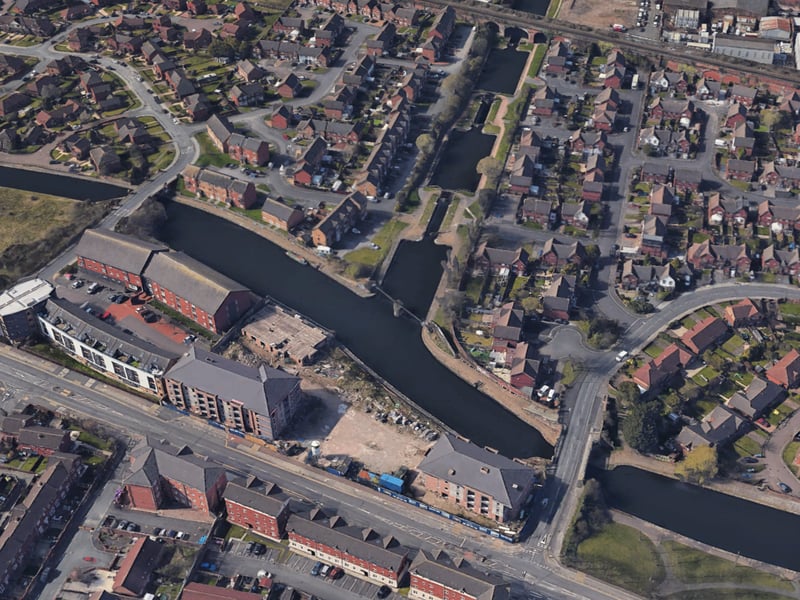
12. Kirkdale South & Vauxhall
IMD score of 54.34. | Google Earth