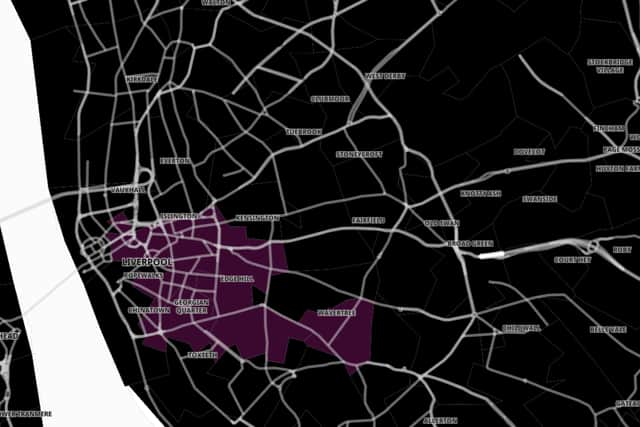
Liverpool neighbourhoods where COVID-19 infections rose the fastest in the past week
and live on Freeview channel 276
Coronavirus case rates are in the North West of England are now higher than they were in London at the peak of the capital’s Omicron wave.
In Liverpool, COVID case numbers have risen by 7% in the latest weekly figures, with 11,389 new infections recorded at a rate of 2275.6 cases per 100,000 people.
Advertisement
Hide AdAdvertisement
Hide AdAlmost 100% of cases in Liverpool are now the Omicron variant.
Across the UK, the North East is the worst affected region, with case numbers rocketing by 73%.
Official figures show it had a rate of 2,609.6 cases per 100,000 residents in the week to January 6, far higher than the peak of 2,043 per 100,000 seen in London in December.
The latest weekly case rates in Northern Ireland, the North West of England and Yorkshire and the Humber are also higher than the capital during its peak infection rate.
Advertisement
Hide AdAdvertisement
Hide AdAcross the UK, there were 1.2 million positive test results in the week to January 6, a 9% rise from the week before.
Case numbers have fallen by 13% in a week in Wales, 9% in London and 4% in the East of England, indicating that the Omicron wave has peaked in these areas.
At neighbourhood level, COVID-19 case rates have been published for the week to 6 January.
Here are the neighbourhoods in Liverpool with the biggest rise in case rates in the past week.


1. Kirkdale South & Vauxhall
Advertisement
Hide AdAdvertisement
Hide AdKirkdale South & Vauxhall had 2705.8 COVID-19 cases per 100,000 people in the latest weekly figures, a rise of 51.6% from the week before.
2. Fairfield West & Newsham Park
Fairfield West & Newsham Park had 2087.6 COVID-19 cases per 100,000 people in the latest weekly figures, a rise of 35.6% from the week before.
3. Albert Dock & Queen’s Dock
Albert Dock & Queen’s Dock had 2106.9 cases per 100,000 people in the latest weekly figures, a rise of 35.5% from the week before.
4. Pier Head
Pier Head had 2151.5 cases per 100,000 people in the latest weekly figures, a rise of 35.2% from the week before.
5. Stoneycroft
Advertisement
Hide AdAdvertisement
Hide AdStoneycroft had 2400.6 COVID-19 cases per 100,000 people in the latest weekly figures, a rise of 34.5% from the week before.
6. Kirkdale North
Kirkdale North had 2659.9 COVID-19 cases per 100,000 people in the latest weekly figures, a rise of 32.9% from the week before.
7. Woolton
Woolton had 2525.0 COVID-19 cases per 100,000 people in the latest weekly figures, a rise of 28.2% from the week before.
8. Garston
Garston had 2607.1 COVID-19 cases per 100,000 people in the latest weekly figures, a rise of 27% from the week before.
9. Fazakerley South
Advertisement
Hide AdAdvertisement
Hide AdFazakerley South had 2937.8 COVID-19 cases per 100,000 people in the latest weekly figures, a rise of 25.7% from the week before.
10. Chinatown, St James & Georgian Quarter
Chinatown, St James & Georgian Quarter had 1887.4 COVID-19 cases per 100,000 people in the latest weekly figures, a rise of 24.5% from the week before.
Comment Guidelines
National World encourages reader discussion on our stories. User feedback, insights and back-and-forth exchanges add a rich layer of context to reporting. Please review our Community Guidelines before commenting.
