


The rankings have been determined using the latest figures from Local Insight, which uses Merseyside Police’s crime numbers to break down residential burglaries in the city into specific neighbourhoods.
The data is for the period from December 2023 to November 2024 - which is the most recent time period for which the figures are available - with the rankings based on the number of break-ins per 1,000 households in each neighbourhood.
- Get the biggest stories from Merseyside in your inbox with Liverpool World’s free newsletter emails.
The city of Liverpool is divided into 60 Middle Layer Super Output Areas (MSOAs) - or neighbourhoods - and the figures refer to where the burglaries occurred, not where they were reported from.

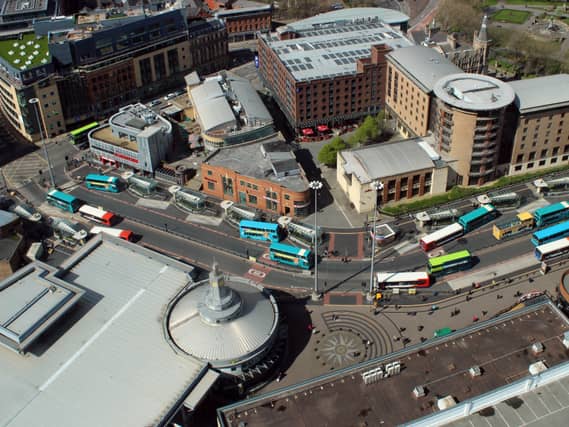
9. Chinatown, St James & Georgian Quarter
In the Chinatown, St James & Georgian Quarter area, there were 14.1 reported burglaries per 1,000 households. | Local TV
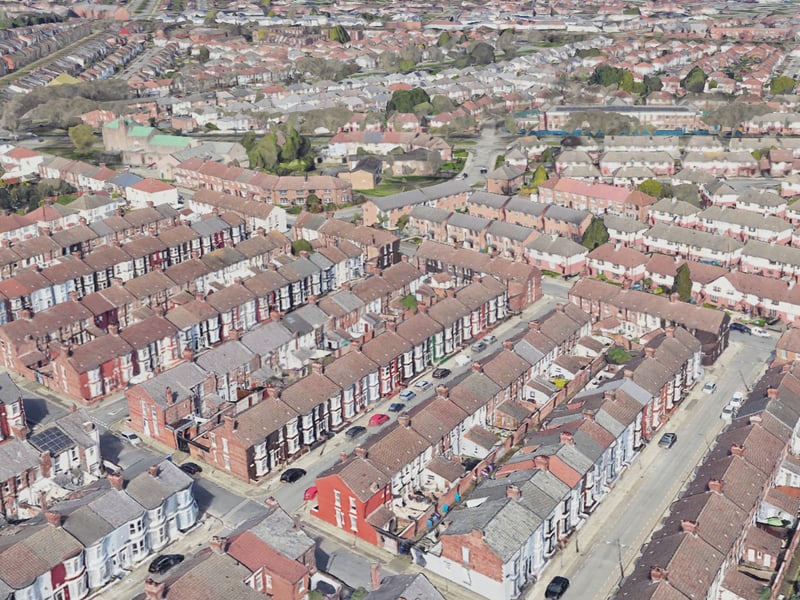
10. Anfield East
In the Anfield East area, there were 14 reported burglaries per 1,000 households. | Google Earth
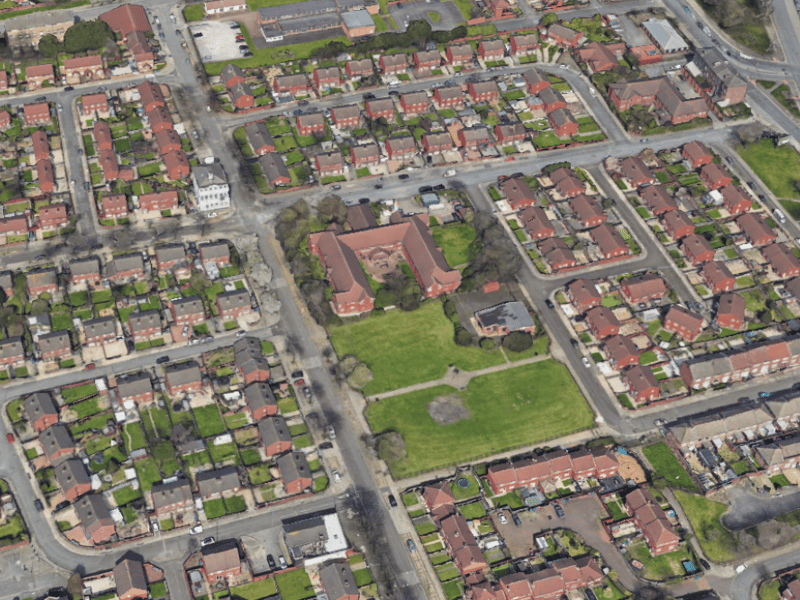
11. Anfield West
In the Anfield West area, there were 12.9 reported burglaries per 1,000 households. | Google Earth
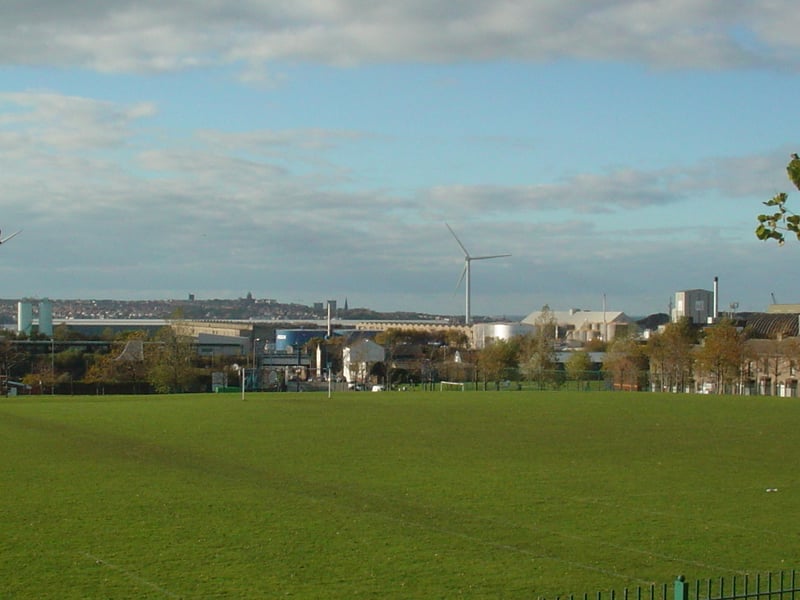
12. Kirkdale South & Vauxhall
In the Kirkdale South area, there were 12.8 reported burglaries per 1,000 households. | Rept0n1x, CC BY-SA 3.0 via Wikimedia Commons