


The figures are provided by Local Insights using Merseyside Police’s crime numbers, which break down criminal offences reported into specific neighbourhoods.
The data is for the period from March 2024 to February 2025 - which is the most recent time period for which the figures are available - with the rankings based on the number of reported criminal offences per 1,000
- Subscribe to our free Liverpool World newsletter to get a round-up of the latest news, sports and food & drink.
The Wirral is divided into 41 Middle Layer Super Output Areas (MSOAs) - or neighbourhoods - and the figures refer to where the crimes occurred, not where they were reported from.
We have listed the 17 neighbourhoods on the peninsula with the smallest number of reported criminal offences in the gallery below. All photos are for illustrative purposes only and figures do not refer to any individual buildings or streets.
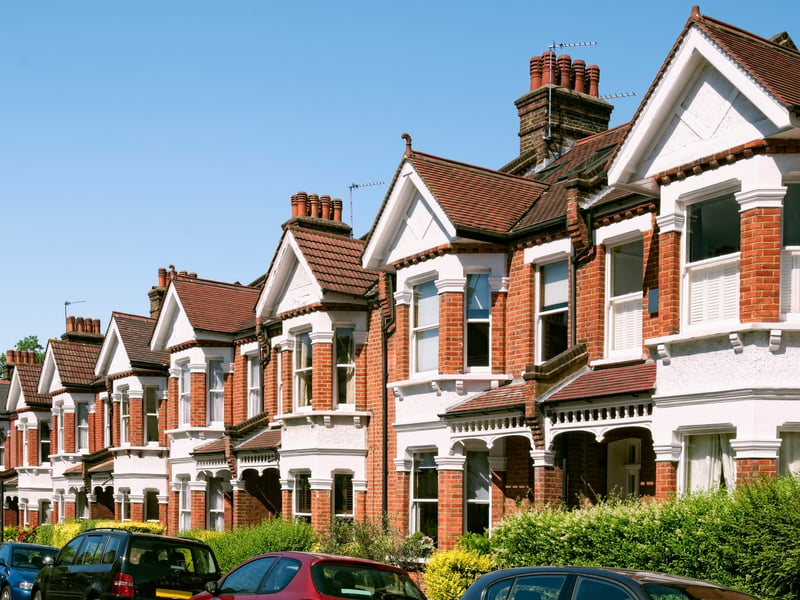
5. Caldy and Newton
In the Caldy and Newton area, there were 25.3 neighbourhood-level incidents of crime per 1,000 residents. | fazon - stock.adobe.com
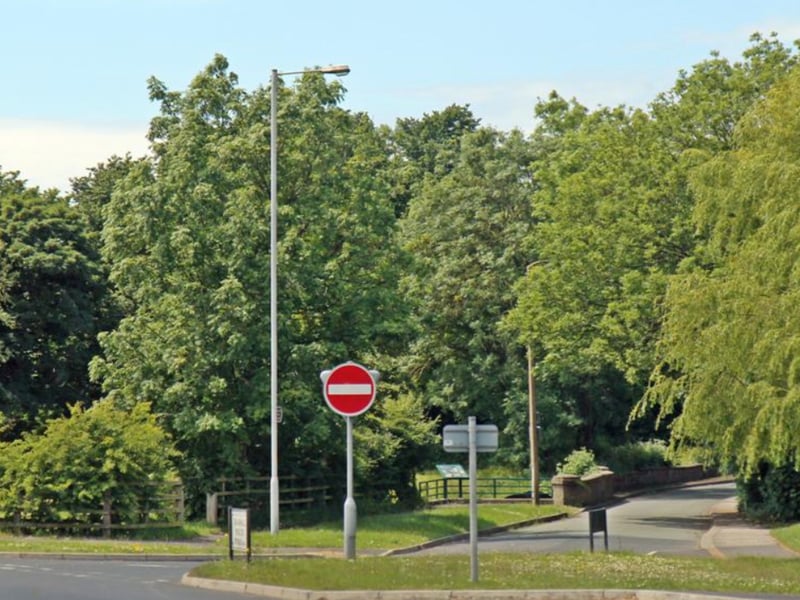
6. Saughall Massie
In the Saughall Massie area, there were 26.9 neighbourhood-level incidents of crime per 1,000 residents. | El Pollock via Wikimedia
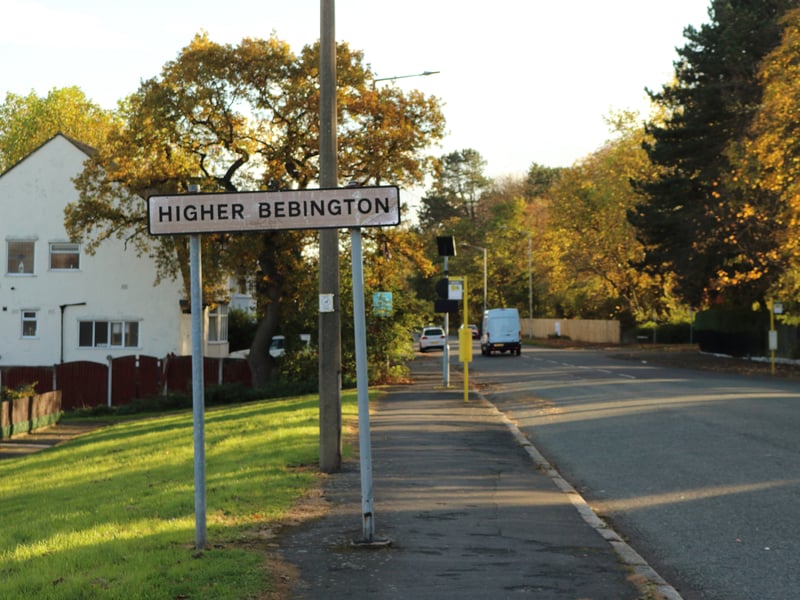
7. Higher Bebington
In the Higher Bebington area, there were 33 neighbourhood-level incidents of crime per 1,000 residents. | Rodhullandemu, CC BY-SA 4.0 via Wikimedia Commons
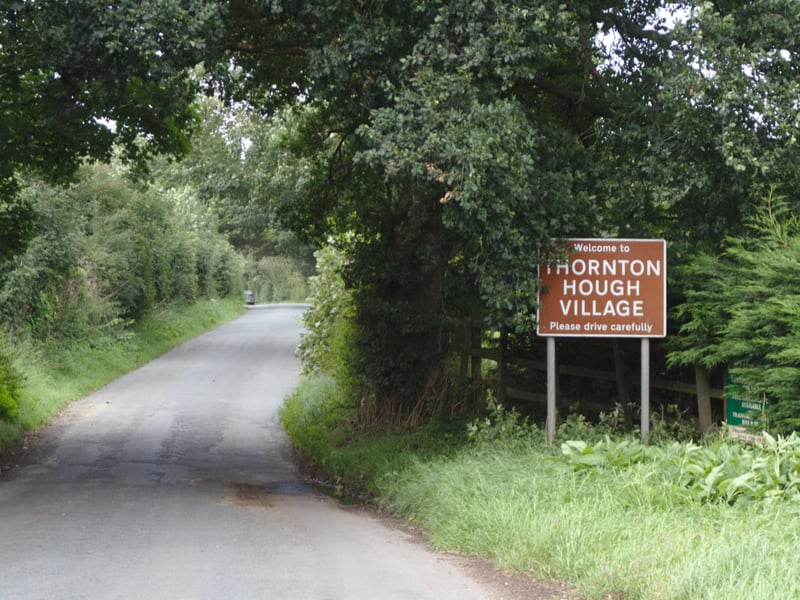
8. Poulton, Raby Mere and Thornton Hough
In the Poulton, Raby Mere & Thornton Hough area, there were 33.5 neighbourhood-level incidents of crime per 1,000 residents. | Phil Nash via Wikimedia