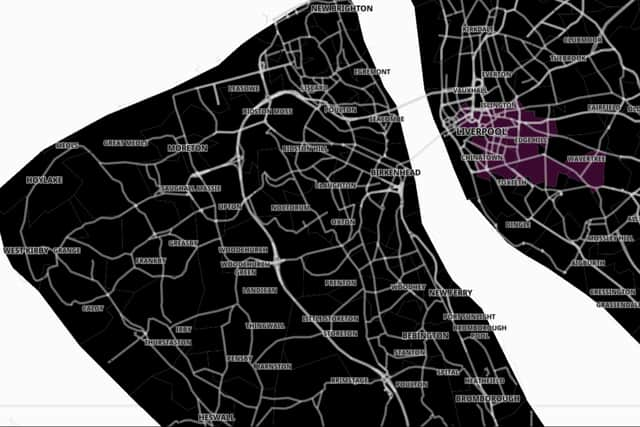
Wirral neighbourhoods where COVID-19 infections rose the fastest in the past week
and live on Freeview channel 276
Coronavirus case rates are in the North West of England are now higher than they were in London at the peak of the capital’s Omicron wave.
In Wirral, COVID case numbers have risen by 6.2% in the latest weekly figures, with 8,174 new infections recorded at a rate of 2520.2 cases per 100,000 people.
Advertisement
Hide AdAdvertisement
Hide AdThere has also been a major surge in COVID-19 hospitalisation numbers in the region, after months of little change.
From March of last year until late December, there had rarely been more than 40 people in Wirral’s hospitals with COVID-19, indeed the figures were often much lower.
But in the last fortnight there has been a significant increase in hospitalisations and there are currently 98 people in Wirral’s hospitals with coronavirus.
Across the UK, the North East is the worst affected region, with case numbers rocketing by 73%.
Advertisement
Hide AdAdvertisement
Hide AdOfficial figures show it had a rate of 2,609.6 cases per 100,000 residents in the week to January 6, far higher than the peak of 2,043 per 100,000 seen in London in December.
The latest weekly case rates in Northern Ireland, the North West of England and Yorkshire and the Humber are also higher than the capital during its peak infection rate.
Across the UK, there were 1.2 million positive test results in the week to January 6, a 9% rise from the week before.
Case numbers have fallen by 13% in a week in Wales, 9% in London and 4% in the East of England, indicating that the Omicron wave has peaked in these areas.
Advertisement
Hide AdAdvertisement
Hide AdAt neighbourhood level, COVID-19 case rates have been published for the week to 6 January.
Here are the neighbourhoods in Wirral with the biggest rise in case rates in the past week.


1. Leasowe
Leasowe had 3133.5 COVID-19 cases per 100,000 people in the latest weekly figures, a rise of 44.7% from the week before.
2. Egerton Park
Egerton Park Noctorum South had 2972.8 COVID-19 cases per 100,000 people in the latest weekly figures, a rise of 30.1% from the week before.
3. Egremont
Advertisement
Hide AdAdvertisement
Hide AdEgremont had 2667.9 cases per 100,000 people in the latest weekly figures, a rise of 29.8% from the week before.
4. Wallasey Village
Wallasey Village had 2921.5 cases per 100,000 people in the latest weekly figures, a rise of 26.8% from the week before.
5. Birkenhead South
Birkenhead South had 2363.6 COVID-19 cases per 100,000 people in the latest weekly figures, a rise of 26.4% from the week before.
6. Thursaston & Irby
Thursaston & Irby had 2447.9 COVID-19 cases per 100,000 people in the latest weekly figures, a rise of 24.6% from the week before.
7. Birkenhead Central
Advertisement
Hide AdAdvertisement
Hide AdBirkenhead Central had 2553.9 COVID-19 cases per 100,000 people in the latest weekly figures, a rise of 22.7% from the week before.
8. Woodhey
Woodhey had 3141.0 COVID-19 cases per 100,000 people in the latest weekly figures, a rise of 22.6% from the week before.
9. Moreton West
Moreton West had 2559.0 COVID-19 cases per 100,000 people in the latest weekly figures, a rise of 16.9% from the week before.
9. Woodchurch
Woodchurch had 2588.0 COVID-19 cases per 100,000 people in the latest weekly figures, a rise of 15.9% from the week before.
Comment Guidelines
National World encourages reader discussion on our stories. User feedback, insights and back-and-forth exchanges add a rich layer of context to reporting. Please review our Community Guidelines before commenting.
