


Some parts of England, including Sefton, have seen house prices skyrocket in the last year analysis of official figures shows.
Almost three quarters of neighbourhoods in England saw an increase in property prices in the year to September 2022, and some have seen hundreds of thousands of pounds added onto the average sale price. But this isn’t the case for property prices in all areas - with one area of sefton seeing a 19% drop.
Property price data published in the UK House Price Index (HPI) shows the average price for a home in England was £312,513 in September 2022, a 9% increase on the previous year when the average property cost £286,832. But some neighbourhoods have seen prices drop.
The Office for National Statistics publishes localised house price figures, based on the HPI, breaking England into 6,809 neighbourhoods known as middle-layer super output areas.
In total 71% of these neighbourhoods in England saw an increase in average house prices, with 12 recording at least a 50% rise, in the year to September 2022.
As the figures cover small areas, average house prices can fluctuate due to low sales numbers and can be heavily influenced by factors such as a new development in the area.
Here we reveal which neighbourhoods in Sefton have seen the greatest fall in property prices in the last year.
Property price data published in the UK House Price Index (HPI) shows the average price for a home in England was £312,513 in September 2022, a 9% increase on the previous year when the average property cost £286,832. But some neighbourhoods have seen prices drop.
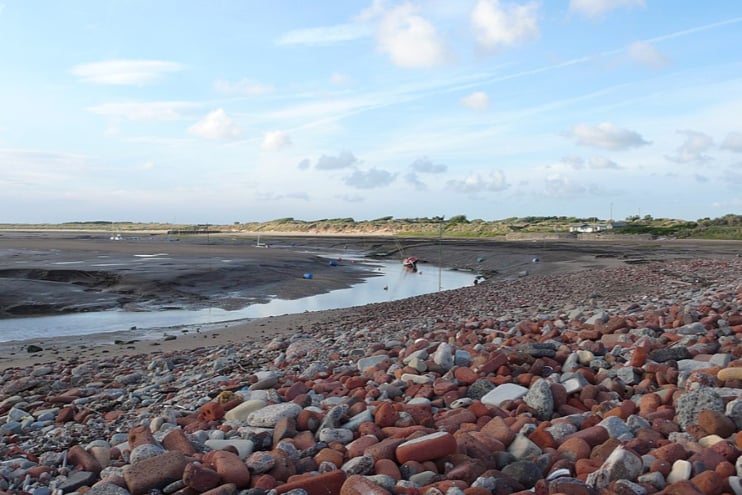
9. Hightown & Thornton
Hightown & Thornton had the ninth fastest falling house prices in Sefton - decreasing by 1.5%, from an average of £265,000 in September 2021 to £261,000 in September 2022. A difference of £4,000 in sale price. Photo: Gary Rogers
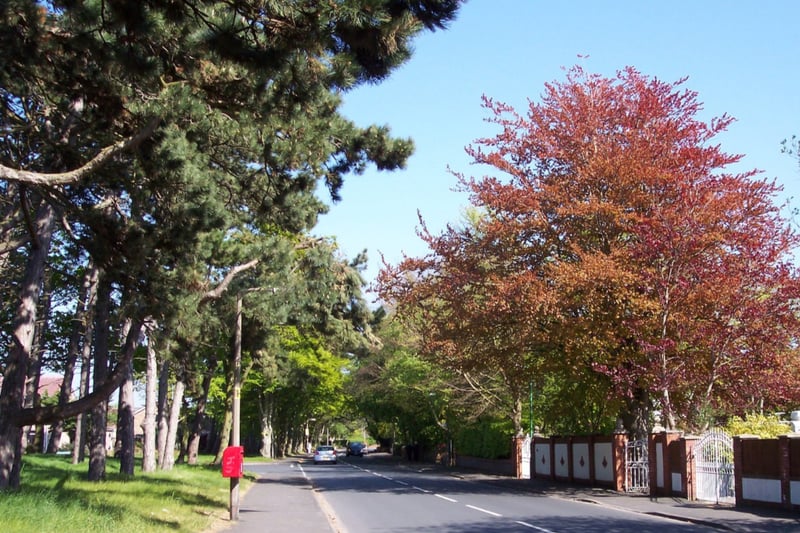
10. Formby Central & Freshfield South
Formby Central & Freshfield South had the tenth fastest falling house prices in Sefton - decreasing by 0.9%, from an average of £280,000 in September 2021 to £277,500 in September 2022. A difference of £2,500 in sale price. Photo: Raymond Knapman via Wikimedia